5/30/2026

AB
Why the Same Metric Looks Different Every Time
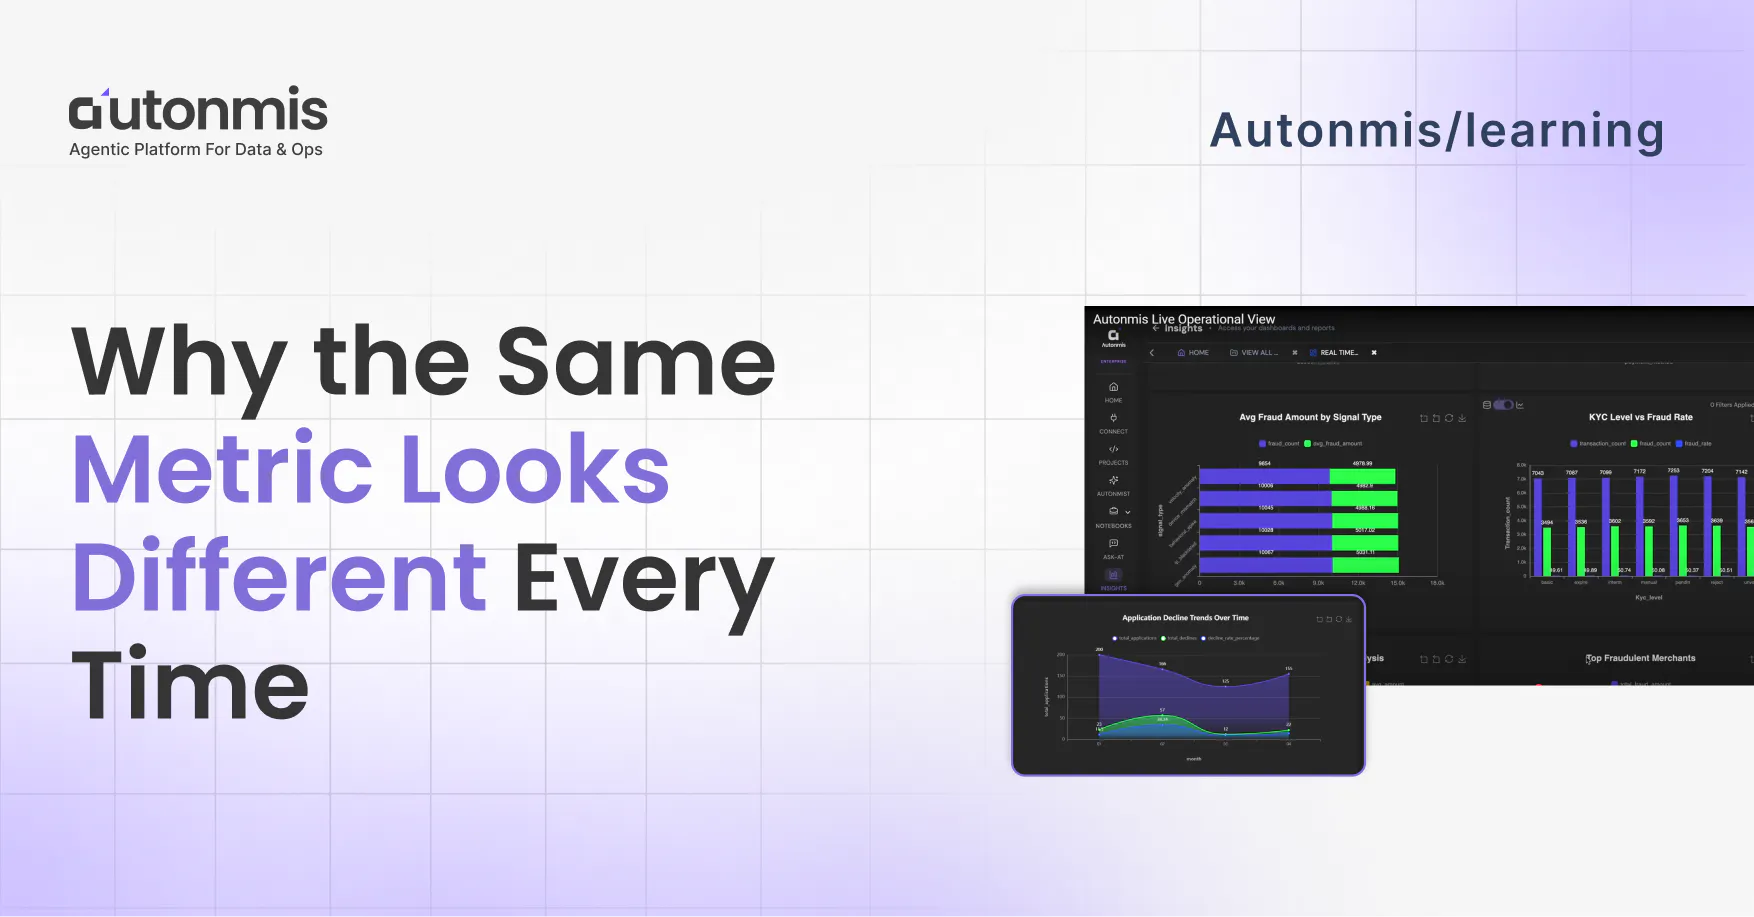
Ask three people at most companies how a key metric is calculated. You get three different answers. All plausible. None the same.
This is not a communication failure. It's what happens when a company has no governed definition and everyone has been doing their best without one.
Where this surfaces
Usually in a meeting.
The CFO pulls a number from one report. The ops lead references the same metric from a different report. The two numbers don't match. Not dramatically, just enough to cause a pause. Someone asks which one is right.
Both people explain their version. Both explanations are reasonable. Neither person is wrong by their own logic.
The next fifteen minutes go to figuring out which definition to use for this meeting. The decision that actually needed to happen gets less time than it should. Sometimes it gets pushed to a follow-up.
This meeting happens at most companies, regularly. It gets absorbed as normal. Nobody fixes it because it doesn't look fixable. It looks like the cost of having multiple teams working with data independently.
It is fixable. But not by calling another alignment meeting.
Why the same metric produces different numbers
Four specific causes. They compound.
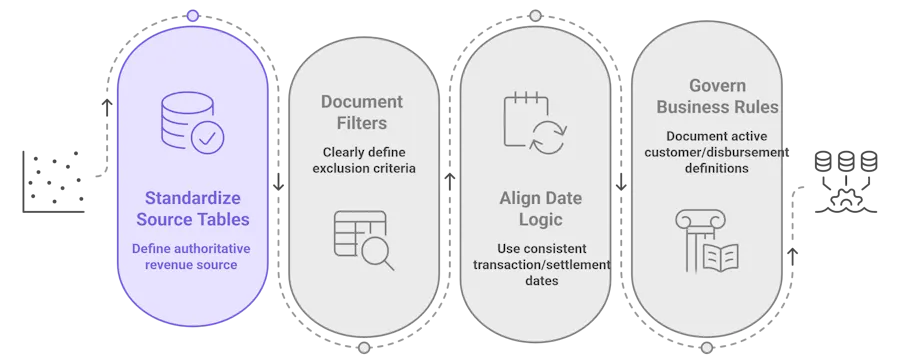
Different source tables. One team pulls revenue from the transactions table. Another pulls from invoices. Both are technically revenue. They are not the same number. Nobody decided which one was authoritative.
Different filters. One analyst excludes test accounts. Another doesn't because that filter was never documented as required. The difference is small most months. In a month with high test activity it shows up.
Different date logic. One report uses transaction date. Another uses settlement date. For most metrics these are identical. For any metric that crosses a month boundary they are not.
Different interpretations of business rules. What counts as an active customer? What counts as a completed disbursement? These questions have answers, but the answers live in individual analysts' heads, based on what they were told when they joined or what made sense to them at the time.
None of these are mistakes. They are reasonable decisions made by people who were never given a single governed definition to work from.
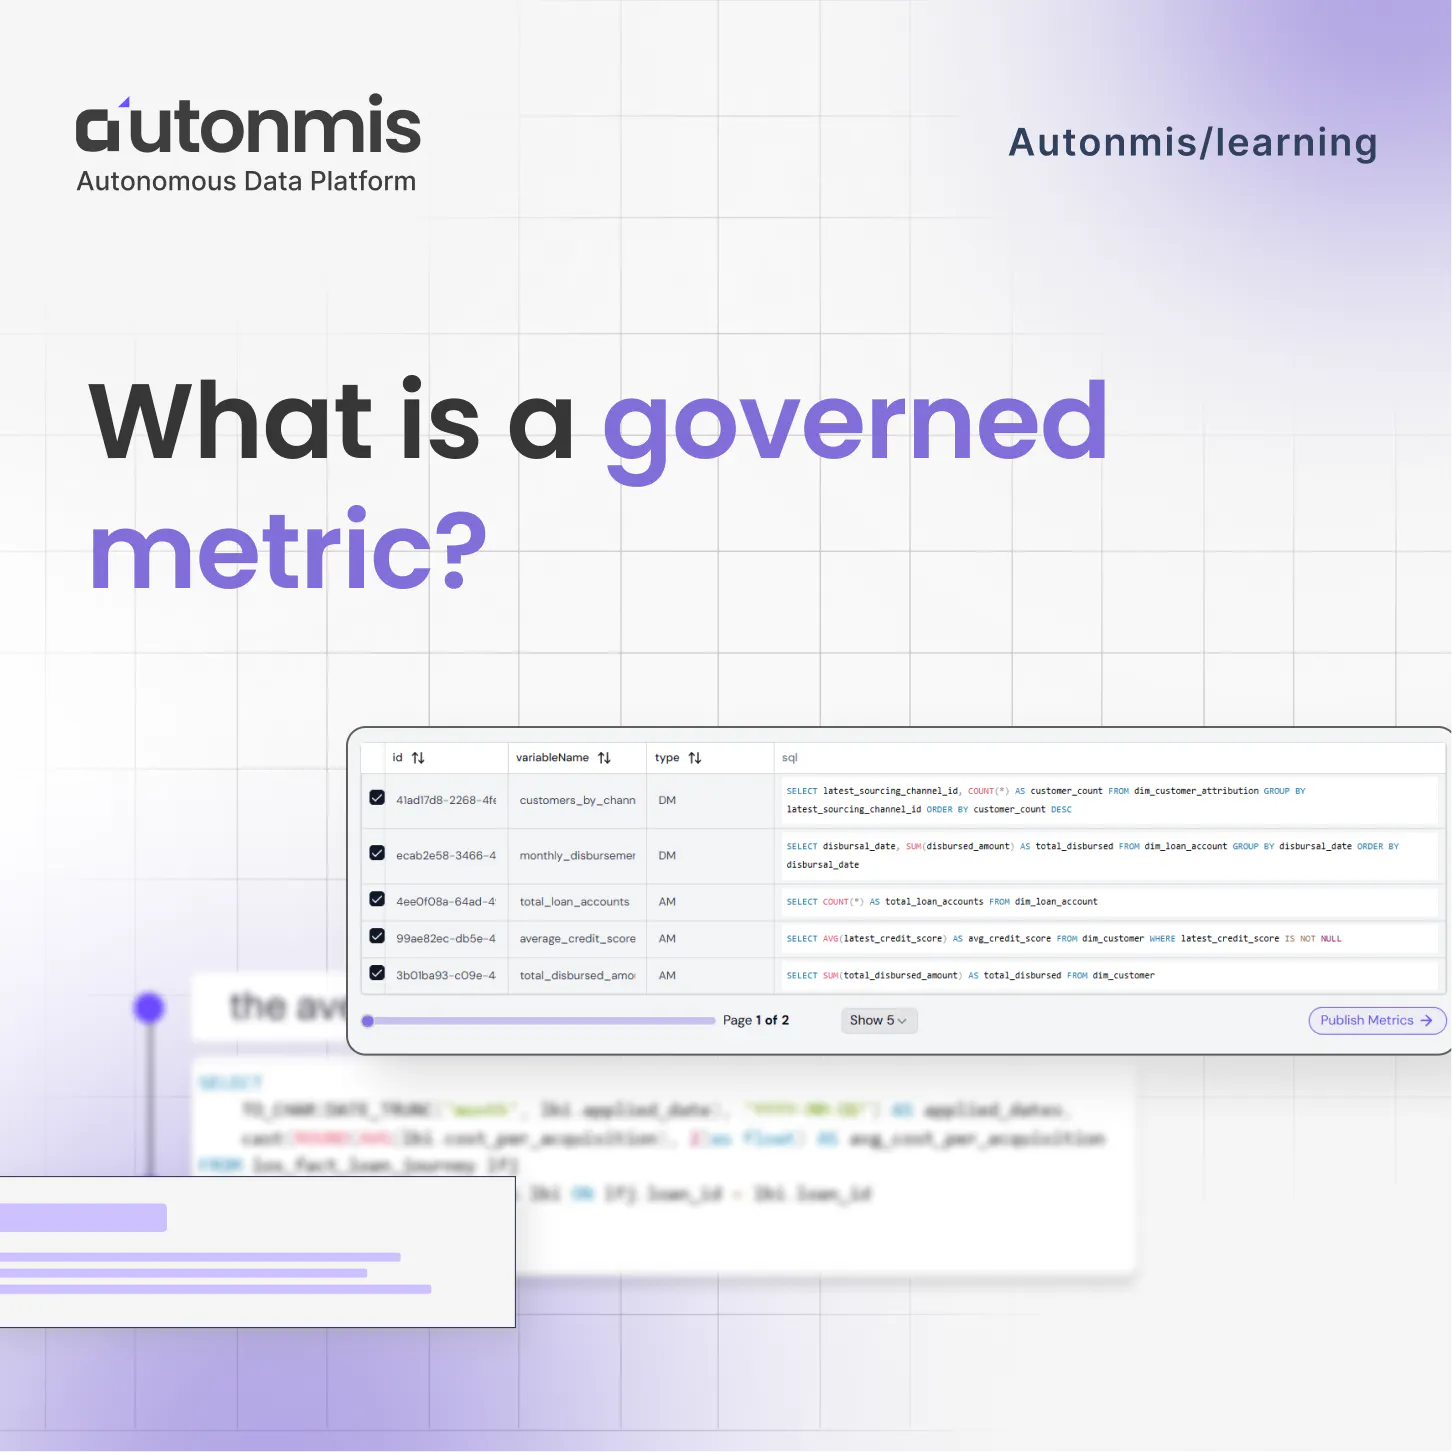
Checkout: What is a governed metric?
Why alignment meetings don't hold
The standard fix is to call the relevant people together, agree on a definition, write it in a shared doc, and move on.
Three months later, the same discrepancy shows up in a different meeting.
Here's why. The meeting produced an agreement. It did not produce a system. The agreed definition lives in a document that not everyone knows exists, that does not automatically apply to any query, and that does not update when the underlying data changes. The next analyst who joins doesn't know about the meeting. The next person who writes a query against the data makes a reasonable choice based on what the table looks like. That choice is not the same as what was agreed.
Agreements drift. Systems enforce.
What a governed definition actually contains
A metric definition that stays consistent is not just a number and a formula. It contains:
What the metric measures and why it matters. Which tables it pulls from and why those sources. What filters apply and what each one is protecting against. What date logic is used and why. What edge cases are excluded and the reasoning. Who owns the definition and who approved it. When it was last changed and what changed.
When all of this exists in one versioned place, every report draws from the same logic. When an analyst leaves, the definition stays. When a new person writes a query, they work from the governed definition, not from their own interpretation of what the table looks like.
That's what makes a number trustworthy enough to present in a board meeting without adding a caveat.
What this costs in practice
Most companies undercount this because the cost is distributed and invisible.
The meeting time alone is significant. Research on executive meeting patterns suggests senior leadership teams at mid-market companies spend a meaningful portion of every data review establishing which numbers are correct before the agenda can begin. That's expensive time going to the wrong problem.
Beyond meetings: decisions made on the wrong number because nobody caught the discrepancy. Decisions delayed because two numbers exist and nobody can explain which one to use. And a slow degradation of trust between leadership and the data team, where the team is blamed for inconsistency that is actually a structural problem, not a people problem.
The data team pays too. When there's no governed definition, every analyst is a partial owner of a metric they didn't design, running queries against logic they partially understand, producing numbers they have to caveat. That's not the work they were hired to do. It's overhead created by absent infrastructure.
Checkout: The Data to Decision Gap: What It Costs and Why It Exists
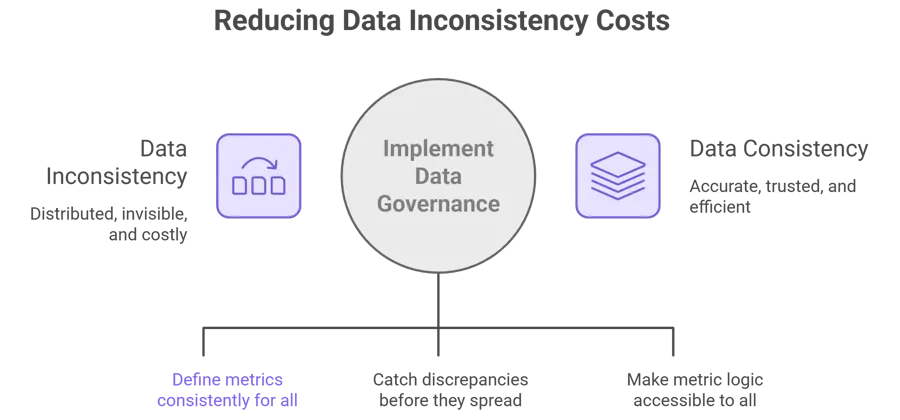
What changes with governance
Without it: each analyst runs their interpretation of the metric. Reports match when people happen to make the same choices. When they don't match, the discrepancy surfaces in a meeting and gets resolved by conversation until the next time.
With it: one definition exists. Every report draws from it. Changes go through an approval step, which means they're deliberate and traceable. When two reports show the same number, it's because they're using the same logic, not because two analysts happened to agree.
For leadership, the practical difference is this: the number in Monday's briefing is the same number that will appear in Friday's board presentation. There's nothing to reconcile. The meeting starts on the actual topic.
Frequently Asked Questions
Why does the same metric show different numbers across reports?
Because there's no single governed definition every report draws from. Each person applies their own interpretation of which table to use, which filters apply, and which edge cases to exclude. All interpretations are reasonable individually. None are the same as each other.
What is a governed metric definition?
A formal record of exactly how a metric is calculated: which data sources, what filters, what date logic, what exclusions, who owns it, who approved it, and when it last changed. Stored in a system rather than a document, versioned so changes are tracked, and applied consistently to every report that uses that metric.
Is this a data quality problem?
No. Data quality problems are about incorrect data. Metric inconsistency is about correct data interpreted differently by different people. You can have perfectly clean data and still have this problem because the issue is the absence of a governed definition, not the quality of the underlying data.
How do you get teams to agree on one definition?
The conversation is easier when it's framed around what the business needs the metric to mean, not whose version is right. Once a definition is agreed and governed, the harder part is maintaining it as the business changes. That's why version control matters as much as the initial agreement.
What does metric inconsistency actually cost?
Meeting time spent reconciling numbers before any agenda item can begin. Decisions made on the wrong figure. Decisions delayed while the right figure is found. And a gradual erosion of confidence in the data team that is actually caused by absent infrastructure, not by the team's competence.
Recommended Learning Articles
4/9/2026
AB
What is a governed metric?

2/6/2026
AB
K-Means Clustering for Anomaly Detection in Business Operations
Actionable Operations Excellence
Autonmis helps modern teams own their entire operations and data workflow — fast, simple, and cost-effective.