2/6/2026

AB
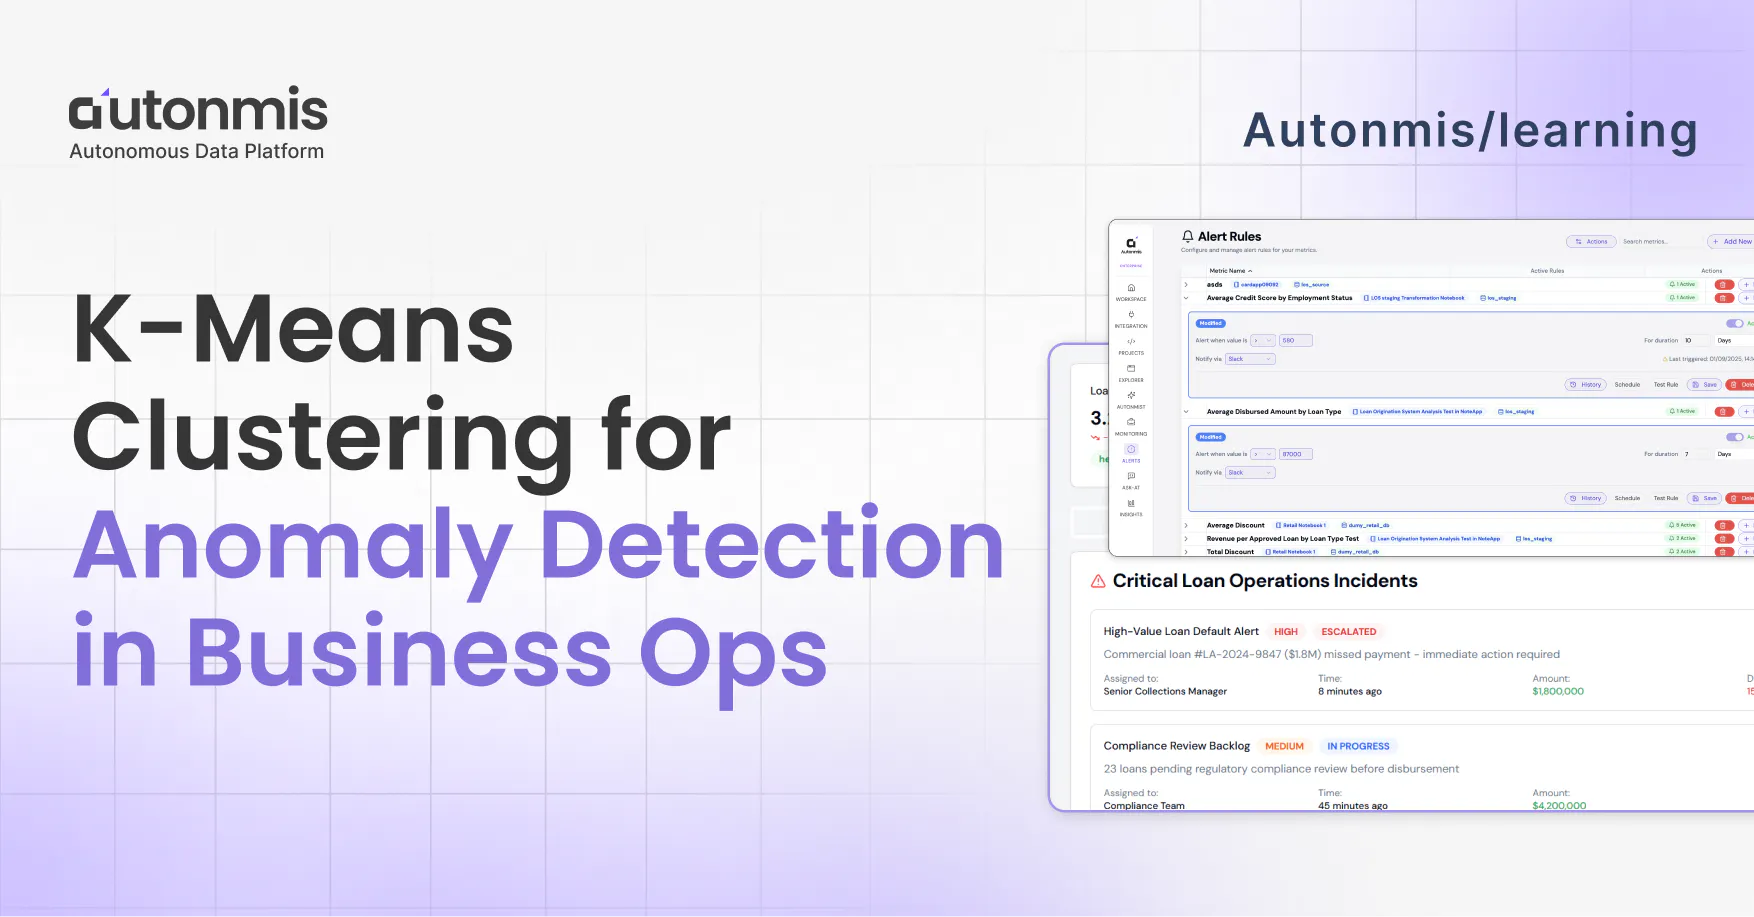
K-Means Clustering for Anomaly Detection in Business Operations
Master K-Means clustering for anomaly detection in business operations. Explore feature engineering, model training, and strategies to minimize operational risks.
TL;DR: You’ll learn why unsupervised clustering (K-Means) is a powerful, low-friction way to detect operational anomalies, which features to extract from event streams, how to train & score in BigQuery and Python, how to convert anomalies into triageable actions on dashboards, and what production pitfalls to watch for. Outcome: a reproducible pattern you can adopt in 2–4 sprints to reduce stuck transactions and operational risk.
Why unsupervised clustering for ops?
Operations teams run into two practical problems:
- You don’t always have labeled failures. Many operational failures are novel (a vendor slow-down, an unusual data field missing, a pipeline stall). Labeling every failure ahead of time is impossible.
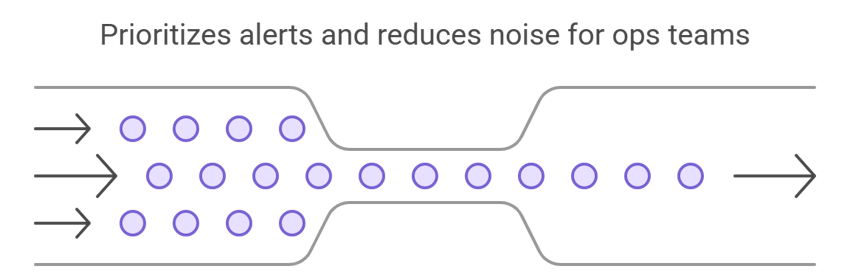
- You need fast, actionable signal. Ops needs prioritized alerts (high business impact first), not an avalanche of noisy outliers.
K-Means (and other clustering techniques) lets you find groups of “normal” behavior and flag points that fall far from cluster centers as anomalies. It’s simple, explainable, fast to train, and adapts well to tabular features that ops events yield (durations, retries, error counts, event densities).
Why it fits operations pipelines:
- Low labeling overhead (unsupervised)
- Fast inference (scales to millions of rows if precomputed)
- Produces interpretable distances (distance → anomaly score)
- Works well as the first stage in a hybrid detection system (rules → clustering → human review)
Checkout: Top 6 Ways to Improve Business Operations (That Actually Work)
Feature engineering: what to extract from ops events (with SQL examples)
Principle: build features that capture the behavioral footprint of a transaction or workflow. Don’t rely on a single metric - combine duration, frequency, retries, error rates, and related context.
Common features:
- duration_ms - total time for the transaction/stage
- retry_count - number of retries within the lifecycle
- error_count - number of errors/exceptions
- event_density - number of events per minute for that transaction id
- downstream_lag - time difference to next dependent stage
- missing_fields_count - missing mandatory metadata flags (0/1 or counts)
- customer_value or loan_amount - dollar exposure (useful for prioritization)
- hour_of_day, day_of_week - to capture seasonality
- vendor_latency_avg - average third-party API latency observed
SQL: feature extraction example (BigQuery-style)
This is a compact pattern. Assume events table: (event_ts, txn_id, stage, duration_ms, error_flag, vendor, amount, metadata).
Notes:
- Use ANY_VALUE for fields that are constant per txn or where you don’t care about exact value.
- Normalize features later (min-max or z-score) before K-Means.
- Add derived columns like amount_bucket for categorical grouping if you want separate models per tier.
Train & score: K-Means in BigQuery / Python (code snippets)
You have two common production-friendly options: BigQuery ML (SQL-first) and scikit-learn (Python-first).
1) BigQuery ML: fast to production with SQL
Create a numeric training set and run a K-Means model stored in BigQuery:
Score new data:
BigQuery ML returns cluster assignments and distances, use distance_to_centroid as your anomaly score.
2) Python (scikit-learn): more flexible for experimentation
Scoring process (production):
- Fetch rolling window of features for new transactions
- Apply saved scaler, predict cluster, compute distance
- If distance > threshold (percentile or fixed), mark anomaly
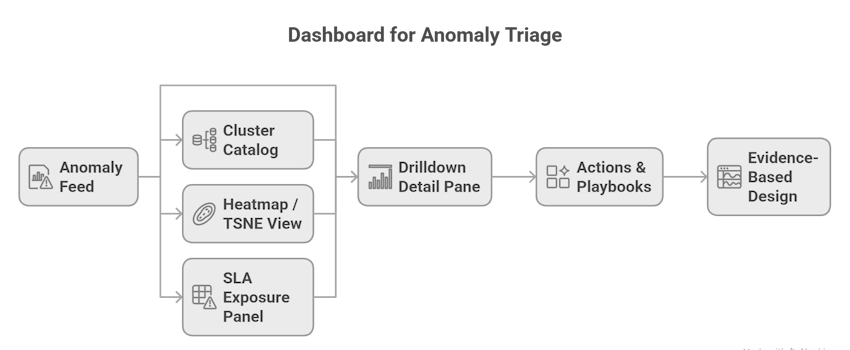
Visualization & triage: dashboards that convert anomalies to actions
Dashboards are the final mile, they must rapidly answer what to do next.
Key dashboard elements:
- Anomaly feed (real-time): list of top N anomalies sorted by business_exposure * distance (a combined priority score). Show txn_id, customer, amount, cluster, distance, time.
- Cluster catalog: sample representative transactions per cluster with quick stats: median duration, common error types, vendor distribution. This helps explain clusters to humans.
- Drilldown detail pane: full event timeline, logs, metadata snapshot, and raw traces for the transaction.
- Heatmap / TSNE view: cluster map showing clusters colored by “normal” vs “anomalous” density. Use UMAP or t-SNE for 2D visualization (in Python).
- SLA exposure panel: aggregates anomalies by SLA tier and estimated penalty exposure (dollars).
- Actions & playbooks: in the detail pane, surface one-click actions: re-run verification, escalate to SME, pause vendor calls, trigger compensations, or open a ticket in your ops workflow.
Design principle: show evidence, not just model text. When you present “Cluster 5 looks anomalous - reason: high retries”, also show counts and the last 3 raw log lines.
Checkout: How Operations Teams Stop Repeating the Same Fixes
Production concerns: retraining, drift, data lineage, auditability
K-Means is simple, but production is where models fail if operational practices are lax.
Retraining & drift
- Clusters morph. Schedule retrain frequency by volume & stability: weekly for high-volume flows, monthly for stable ones.
- Monitor cluster stability (Adjusted Rand Index between consecutive models) and feature distribution drift (population statistics, PSI).
Thresholds and false positives
- Don’t use a distance threshold blindly. Combine:
- distance percentile (e.g., top 0.5% distances)
- domain rules (e.g., error_count > 0 AND retry_count > 2)
- business filters (amount > 10k)
- Validate top anomalies with a short human-review loop before auto-escalation for non-critical tiers.
Data lineage & auditability
- Store the feature snapshot used for each decision (raw feature values, timestamp, model version, cluster id, distance). This is essential for compliance, dispute resolution, and postmortems.
Explainability
- KMeans is reasonably explainable. Provide:
- top contributing features by centroids difference
- representative examples from cluster
- When showing explanations to non-technical users, always pair model text with evidence (counts/logs).
Operationalization
- Precompute features in a streaming or micro-batch pipeline (Beam / Dataflow / Airflow). Keep model scoring as a lightweight service (Cloud Run, Lambda, or DB UDF if using BigQuery ML) to meet latency targets.
- Monitor model performance: precision of human-validated anomalies, false positive rate, time to remediation.
Real examples / pseudo-case (anonymized) - before / after metrics
Pseudo-case: Payments Ops at “FinPay”
- Before KMeans: Ops had 12k alerts/day; 75% were low-impact infra noise. Average time-to-detect critical stuck payments = 6 hours. NPA-like lost settlement exposure (monthly) ≈ $120k.
- After KMeans + triage rules: Top anomalies are reduced to 140/day (prioritized by distance × amount), average time-to-detect critical stuck payments = 22 minutes, human-confirmed critical incidents reduced by 82%. Monthly settlement exposure dropped to ≈ $25k (79% reduction).
- Why it worked: anomalies surfaced patterned problems (vendor slow-down at midnight) and high-value transactions with missing metadata, both human teams had simple playbooks to remediate.
(These numbers are representative; exact results depend on volume, product mix, and process maturity.)
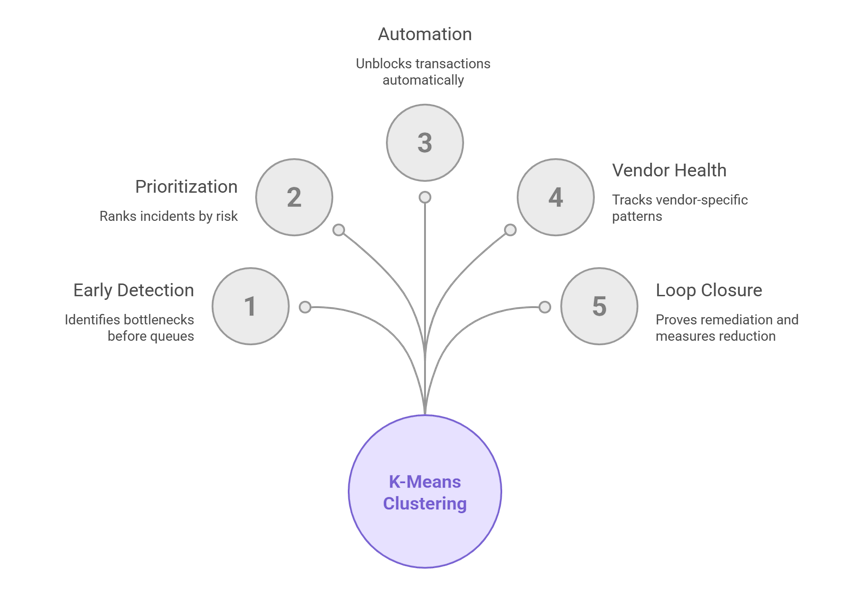
How this reduces stuck transactions
- Detect bottlenecks early. K-Means highlights transactions that don’t fit normal clusters (longer duration, repeated retries, missing metadata), letting teams act before queues back up.
- Prioritize high-risk transactions. Use distance × monetary_exposure to rank incidents — fix revenue-impacting transactions first.
- Automate low-friction remediations. For common anomaly patterns (missing field, transient vendor timeout), auto-retry or auto-supplement missing data to unblock transactions.
- Track third-party health. Clustering often surfaces vendor-specific patterns (e.g., cluster of transactions with vendor_latency > X) enabling vendor escalation and SLA enforcement.
- Close the loop. With feature snapshots and model versioning, you can prove remediation steps and measure the reduction in “stuck” incidents over time.
Checkout: What is Operational Intelligence (OI)? Complete 2025 Overview
Quick production notes & pitfalls (must-callouts)
- Don’t rely on a single feature, use combined features (duration, retries, errors, event density).
- Clusters morph: monitor drift and retrain periodically (weekly or monthly depending on volume).
- Guard against false positives: validate top anomalies with domain rules then tune thresholds.
- Ensure auditability: store cluster assignments + distances and the feature snapshot used for the decision (for compliance & debugging).
- Limit hallucination for AI features, when exposing cluster explanations to non-technical users, show evidence (logs / counts) not just model text.
Final note (for technical leaders)
K-Means is not a silver bullet, but it’s a high-leverage, low-friction pattern to add to your ops toolbox. Use it as an early-warning stage tiled into a broader detection stack: rules → clustering → supervised models → human review → automation. If you do the basics—strong features, a clear priority function (distance × exposure), and disciplined audit logs, you’ll get a lot of value quickly.
Recommended Learning Articles
5/30/2026
AB
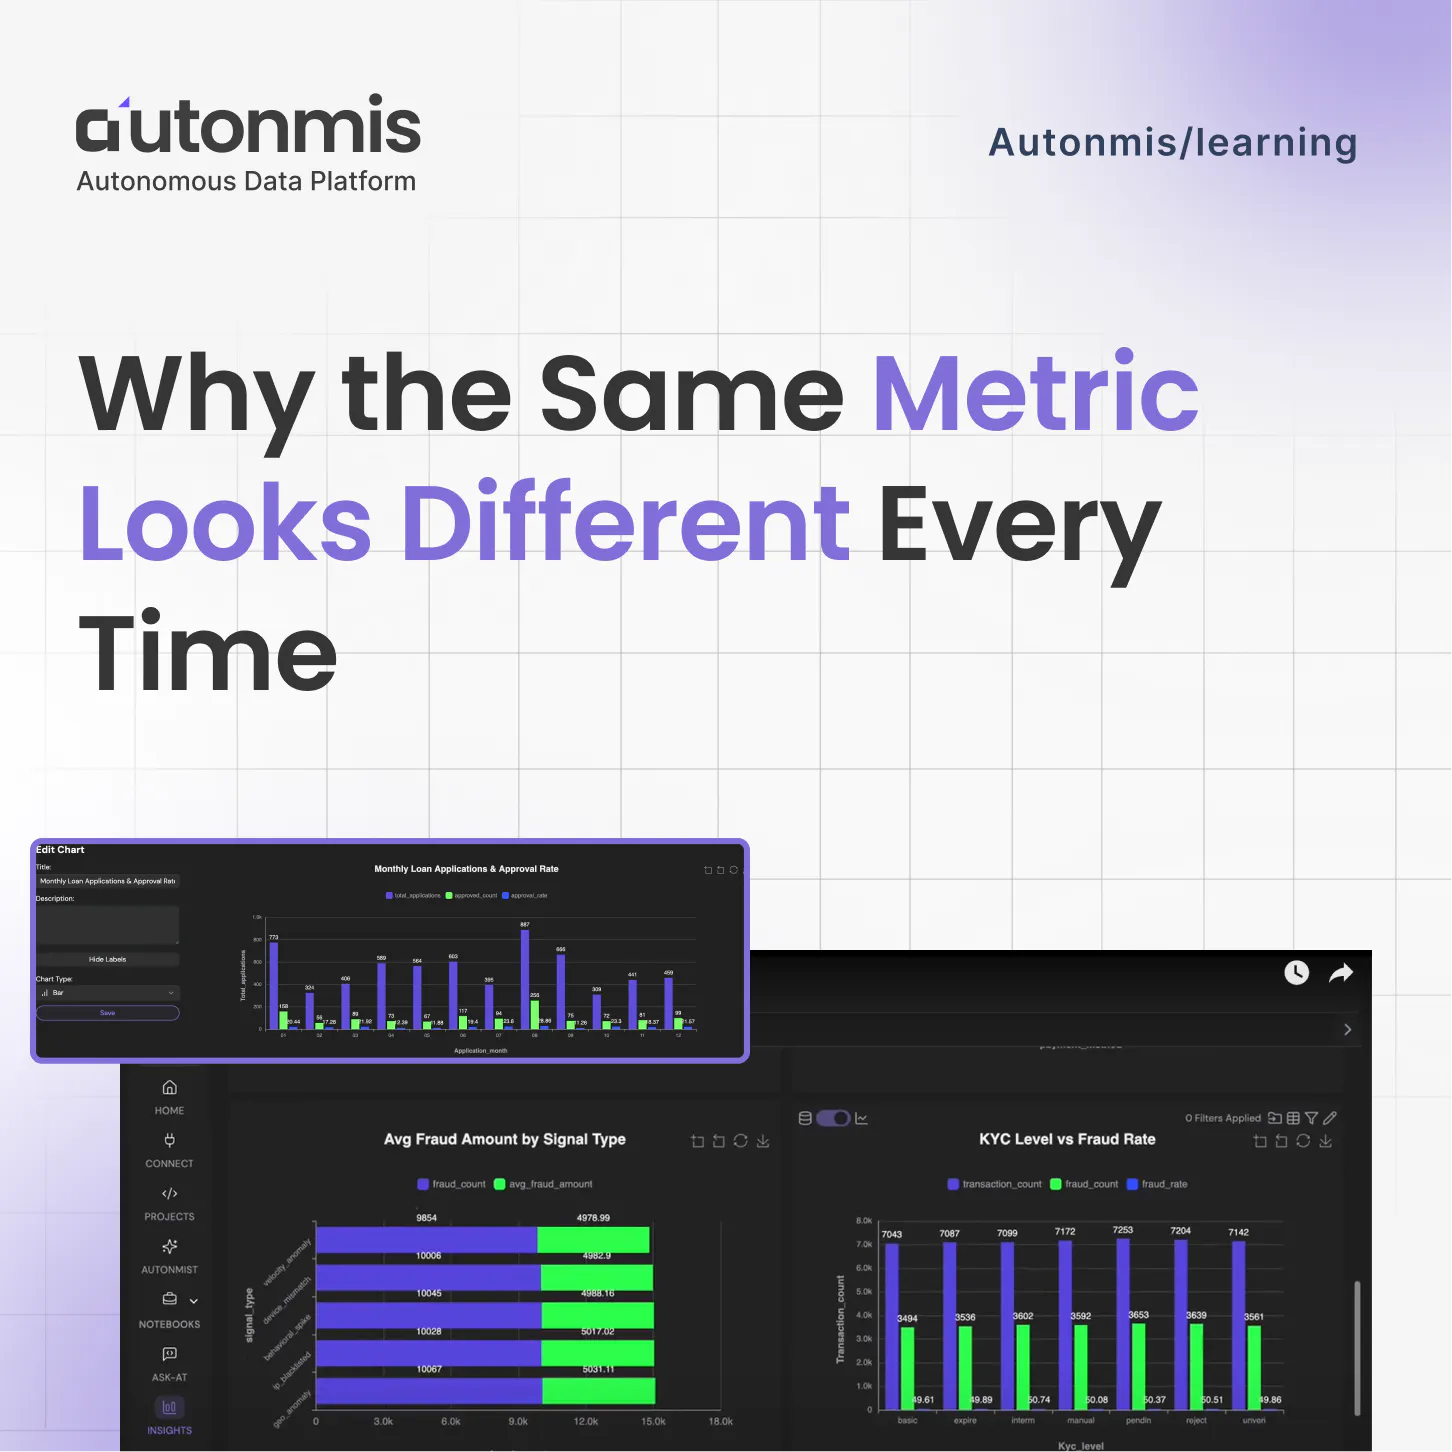
Why the Same Metric Looks Different Every Time
4/9/2026
AB
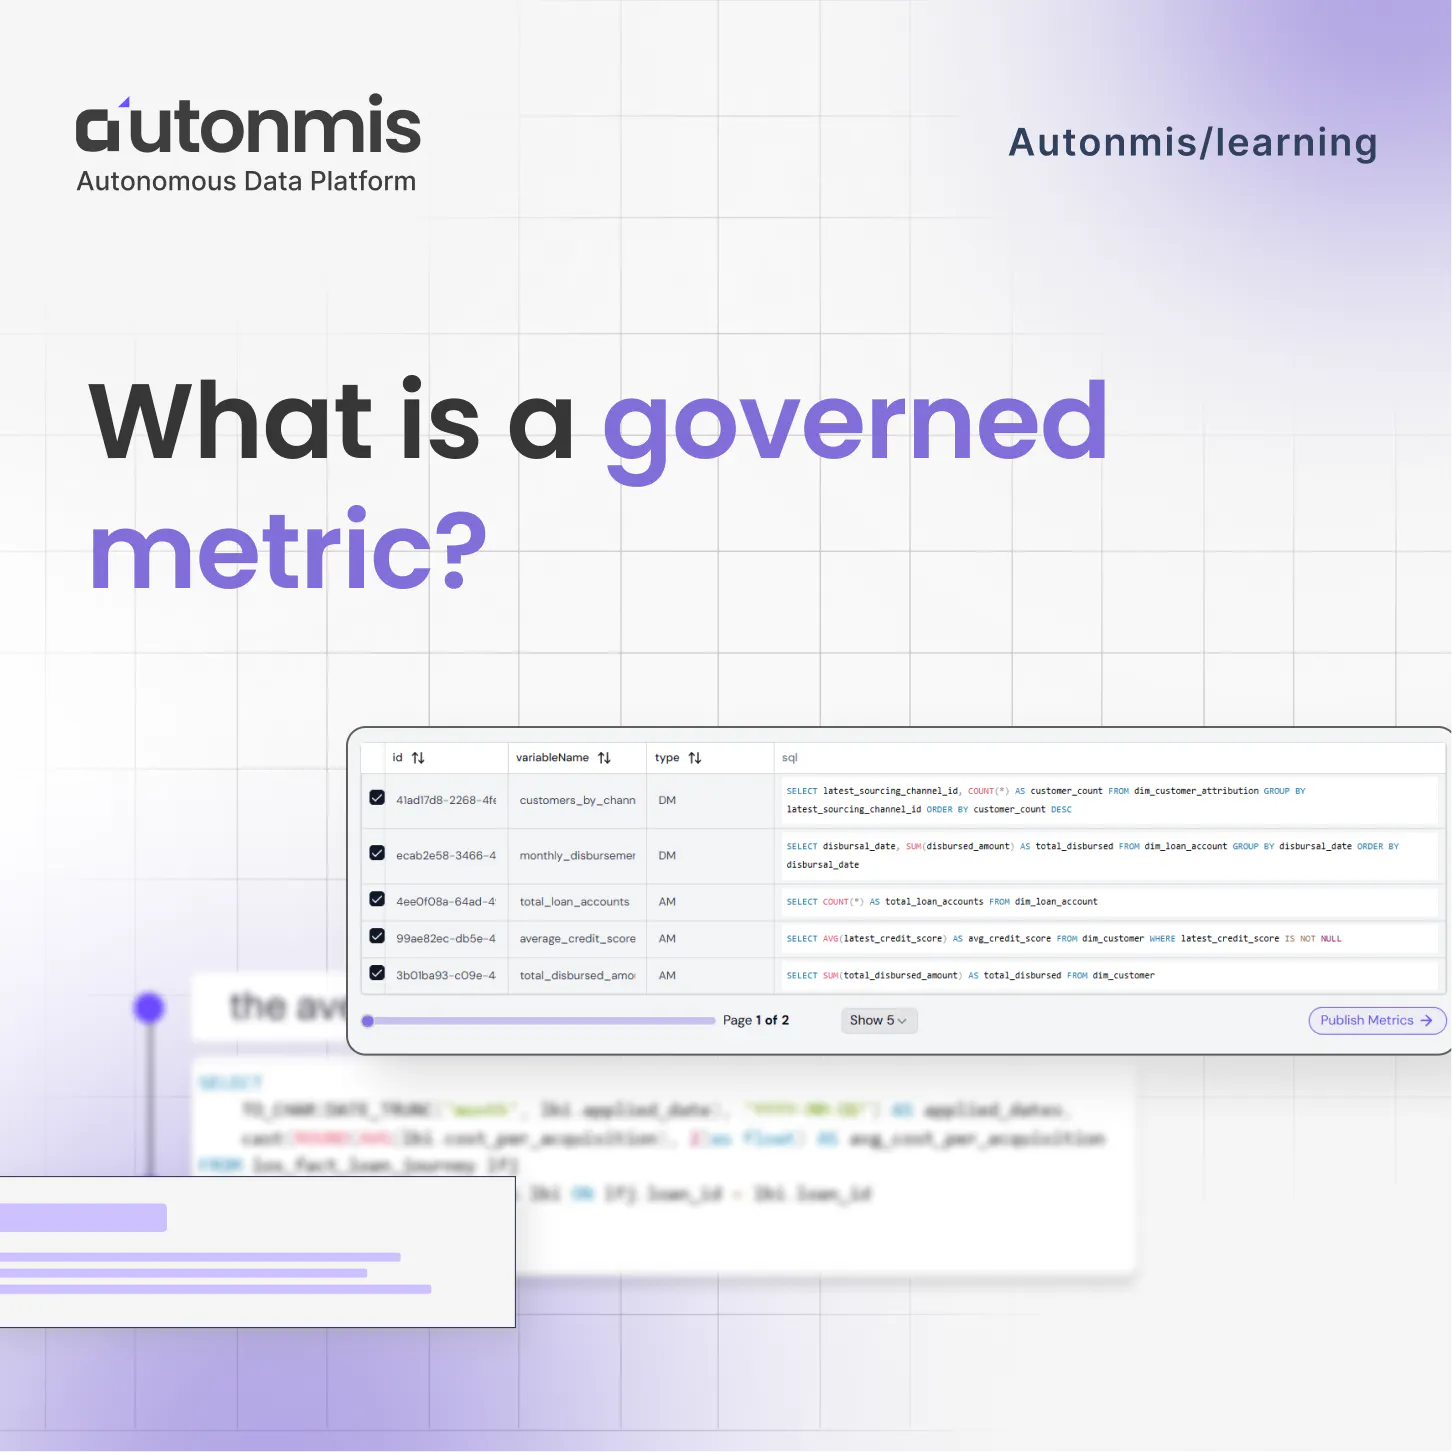
What is a governed metric?
Actionable Operations Excellence
Autonmis helps modern teams own their entire operations and data workflow — fast, simple, and cost-effective.