Table of Contents
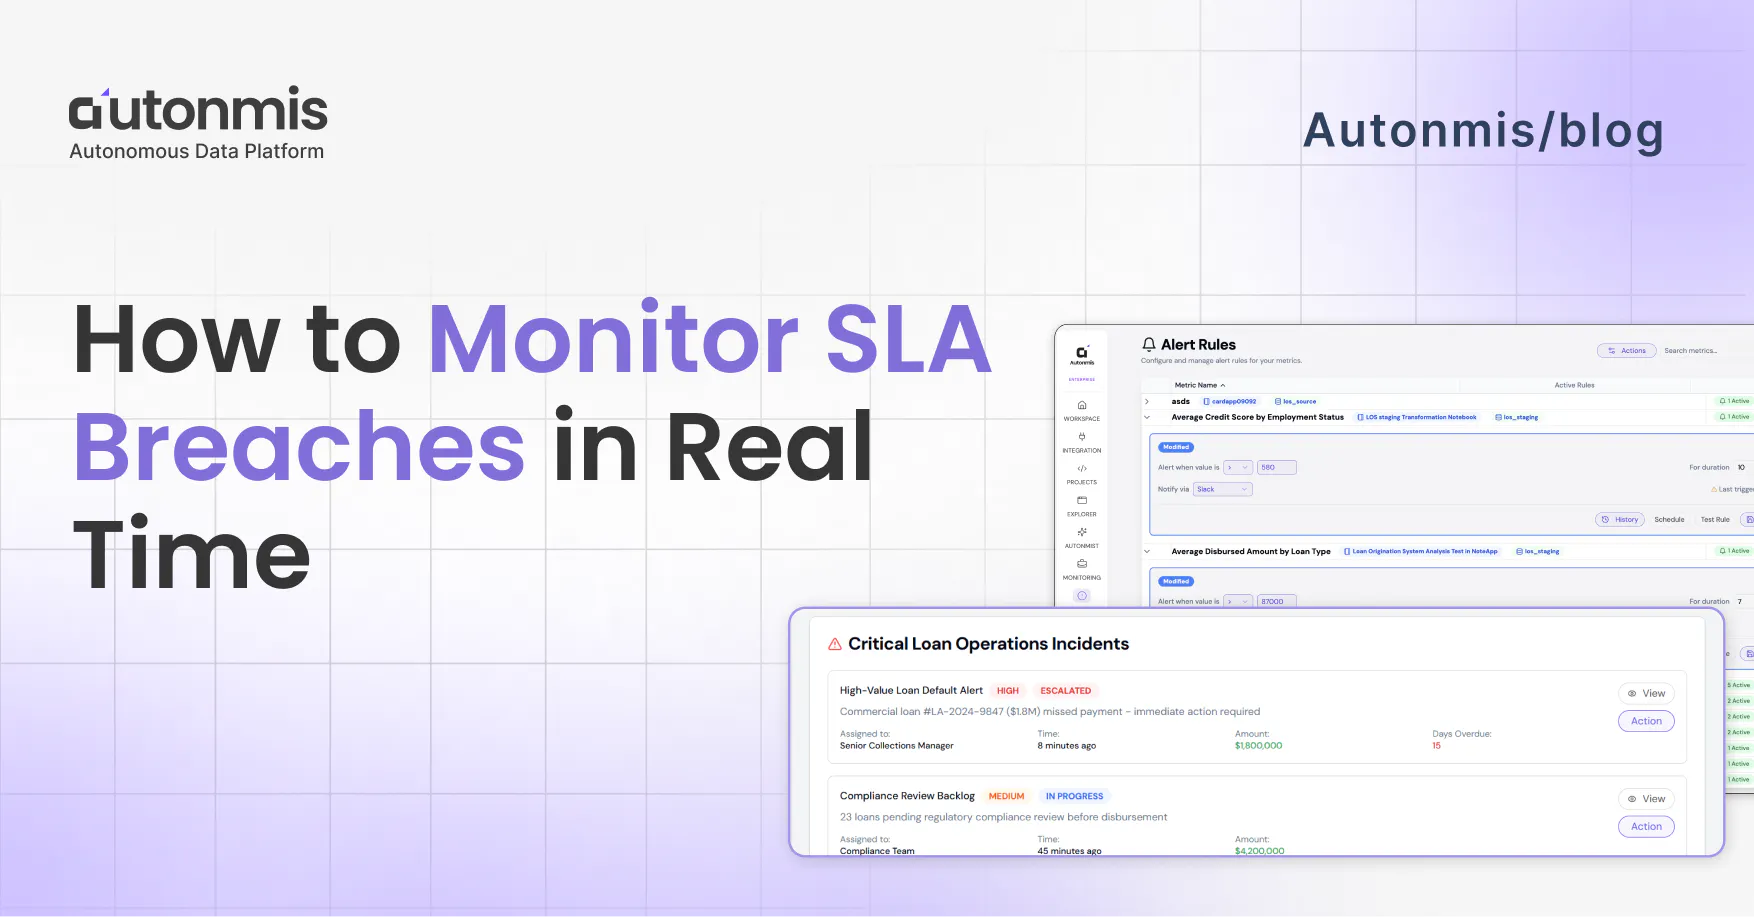
How to Monitor SLA Breaches in Real Time
Explore how to effectively monitor SLA breaches in real-time. Learn to set actionable thresholds and transform your data into proactive alerts for better operations.
March 12, 2026

AB
Why breaches show up late
In most mid-sized ops teams, the flow goes something like this. Something in your data crosses a threshold, a loan account where the reminder didn't go out in time, a delivery exception that's been sitting unresolved past the promised window. The data captured it. It's sitting in a table somewhere.
But the data doesn't move on its own. Someone has to pull it, clean it up, build something around it, and pass it to someone else. By the time that chain plays out, you're looking at yesterday's numbers at best. Often it's the morning report that surfaces a problem that started two days ago.
That's not an analyst problem. That's just how most ops data is set up built to report, not to alert.
The result is that SLA monitoring in most companies is actually SLA reviewing. You look at what happened. You note that something was missed. You have a conversation about why. But the window to catch it early is already closed.
What Real-Time SLA Monitoring Actually Requires
Start by writing your SLAs as numbers
You probably have SLAs defined somewhere. A policy doc, a client agreement, maybe just an internal understanding. The problem is they're not in any system as an actual threshold, so nothing can check against them.
That's the first thing to fix.
Go through your core processes and write down a number for each:
- Loan disbursement: document submitted to funds released - 24 hours
- KYC completion: application in to verification done - 48 hours
- Mandate failure retry: failure logged to retry sent - same business day
- Customer first response - 4 hours
Simple list. But once you have it, everything else follows. Without it, you're watching data and hoping you notice something. With it, you can actually set up a system that tells you.
Before you finalize these numbers though - pull your last 3 months of completion data first. If 85% of your disbursements already finish in 18 hours, don't set a 12-hour SLA. Windows that are too tight just mean constant alerts your team starts ignoring. Set them around your actual 90th percentile.

Checkout: How Real-Time Ops Intelligence Enables Faster Decisions
End-of-day reports won't cut it here
This is where a lot of setups go wrong.
If your monitoring runs on a batch that pulls data at 8pm and sends a report at 9am, you don't have real-time monitoring. You have a nicely formatted summary of yesterday. The SLA clock starts the moment a file enters your system - your monitoring needs to see it close to that same time.
For most lending or payments operations, you're looking at connecting three systems: your LOS, your LMS, and your payment processor. Feeding them into one place, continuously.
Before you assume that's a big engineering project, check if your systems already have webhooks. Most modern platforms do. That's often a few days of integration work, not a month-long build.
One thing that actually matters more than the pipeline: clean timestamps. For TAT monitoring to work reliably, you need consistent timestamps across systems, a transaction ID that follows the file end to end, and a clear definition of what counts as "started" and "completed" for each process. If those are messy, sort them first. Bad data gives you unreliable alerts, and once your team gets a few false alarms, they stop trusting the system entirely.
Don't alert at 100% - alert at 70%
If your alert fires when the breach already happened, what are you supposed to do with it? Document it. That's it.
Set your warning alert at 70–80% of the window instead. That's when there's still time to act.
- 24-hour SLA → alert at 17–18 hours
- 4-hour SLA → alert at 3 hours
- 48-hour KYC SLA → alert at 36 hours
- Same-day mandate retry → alert by 3pm if the failure happened overnight
That gap between 70% and 100% is your window. You can reassign the case. You can escalate it. You can call the customer before they call you. It's tight, but it's something.
Worth adding: a second alert at 90% that automatically goes one level up. If the first one didn't get handled, someone more senior hears about it before it's too late. Don't rely on one person seeing one notification and acting on it.
Name a person for every alert, not a team, not a shared inbox
Shared inboxes are where alerts go to die.
When a notification lands in ops@yourcompany.com or a general Slack channel, everyone figures someone else is dealing with it. That's how a 70% warning sits unread for two hours and becomes a breach.
Each type of exception needs one owner. Specifically:
- Disbursement file stuck at bureau check → disbursement team lead
- KYC review queue backing up → KYC ops head
- Mandate not retried → collections manager
- Customer query at 80% of window → assigned account manager
The technical part of this routing rules, escalation logic - takes an afternoon. Getting alignment on who owns what takes longer and involves more uncomfortable conversations. Do that part anyway. The system won't work without it.

Checkout: What is Operational Intelligence (OI)? Complete 2025 Overview
Each process breaches differently, watch the rigAgeht thing
Disbursements Total file age isn't enough. Watch stage-level age. A file that's been sitting at bureau check for 6 hours might look fine on the overall TAT metric, until it doesn't. Anything that hasn't moved between stages in 4+ hours should flag, regardless of where the total stands.
KYC Track two things at once: individual application age, and how fast the review queue is growing vs being cleared. One application stuck at 72 hours is one breach you can fix. A queue growing faster than it's moving is a batch of breaches about to happen, and that shows up in queue depth before it shows up in individual TAT numbers.
Collections (0–30 DPD) Don't watch aggregate contact rate. Watch days since first meaningful contact attempt per account. Any account in the 0–30 DPD window that hasn't had a real contact attempt in 48 hours needs to come up now, not in Friday's weekly summary. That window is when recovery is still realistic.
NACH mandate failures These fail overnight. Under normal reporting, your team finds out at 9am for something that happened at 11pm, that's 10 hours gone before anyone starts. Set alerts to fire within business hours on the day of failure. Same day, not next morning.
The alert is only half of it
Here's something most teams miss when they set this up: you also need to know what happened after the alert fired.
Did someone receive it? When did they actually see it? What did they do? When was it resolved?
Without that record, you don't know if your monitoring is actually working or just making noise. And in regulated businesses, when a compliance audit asks how a specific case was handled, you want a five-click answer, not an hour of searching through email threads.
More practically: if you find alerts are firing and nothing is happening downstream, this is where you see exactly where the handoff is breaking down. Is it the alert routing? Is it the owner not seeing it? Is it unclear what to do? The record tells you.
Pick one process and do it properly
Don't try to set this up for everything at once. Pick the one process where a breach is most painful right now most expensive, most visible, biggest regulatory risk and get that one working properly end to end.
Live data feeding in. Thresholds configured. Alerts going to the right person. Resolution being tracked.
Run it for two weeks. Some alerts will be useful, some will be noise. Thresholds will need adjusting. You'll find out where ownership actually breaks down vs where you thought it would.
Take what you learn there into the next process. It goes faster the second time. Faster still the third.
After a few months of this, your team is catching things before they escalate. Morning reports become a confirmation of what you already handled, not the place you find out things went wrong.
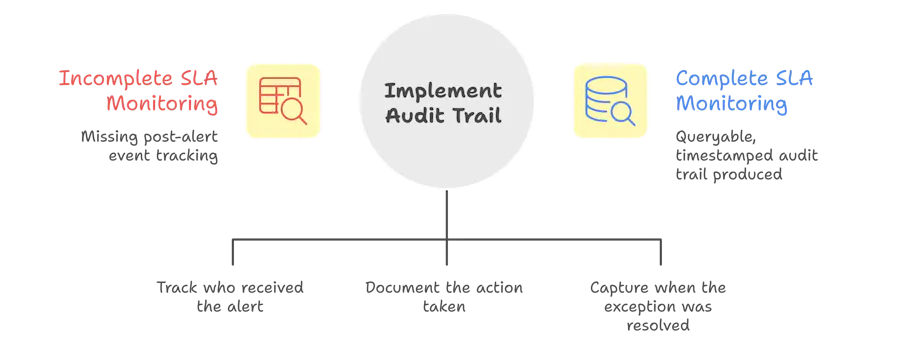
The Audit Trail Problem
One thing most teams miss when setting up SLA monitoring: the alert is only half the system. You also need a record of what happened after the alert fired.
Who received it? When? What action was taken? When was the exception resolved?
This matters for two reasons. The first is internal accountability, if alerts fire and nothing happens, you need to know where the handoff broke down. The second is compliance: in regulated industries, the ability to show a complete, timestamped audit trail of how each exception was handled is often as important as preventing the breach in the first place.
A real-time SLA monitoring system should produce: the exception, the owner, the time of alert, the action taken, and the resolution time. All of it queryable, not buried in email threads.
Checkout: The Future of Business Operations: From Firefighting to AI-Driven Flow
The Bottom Line
Real-time SLA monitoring isn't a feature you turn on. It's an architecture you build or adopt that connects live operational data to defined thresholds to clear alert owners to a documented resolution trail.
Teams that have this in place catch breaches at the 70% window. They intervene before the customer is affected. They have an audit trail ready when compliance asks for it.
Teams that don't are discovering yesterday's breaches in this morning's report.
What Autonmis does with this
Everything described in this article, live data pipelines from your LOS and LMS, threshold-based alerts at 70% of the SLA window, ownership routing to the right person, audit trail of what happened after - is what Autonmis is built to do for operations teams in lending, payments, and financial services.
Most teams we work with aren't starting from zero. They have data. They have systems. What they're missing is the layer that connects those systems to the people who need to act in time to actually act.
If that's the gap you're trying to close, it's worth a conversation.
Frequently Asked Questions
What is the difference between SLA monitoring and SLA reporting?
SLA reporting tells you what happened compliance rate, breach count, average TAT over a past period. SLA monitoring watches what's happening right now and surfaces at-risk cases before a breach occurs. Reporting is backward-looking; monitoring is forward-looking.
How early should you alert before an SLA breach?
Most ops teams find 70-80% of the window is the right trigger point enough time to act, but not so early that it creates noise. For a 24-hour SLA, that means alerting at 17-18 hours. For a 4-hour SLA, alerting at 3 hours.
Can SLA monitoring work without a dedicated data team?
Yes, if the monitoring layer is built on top of your existing operational systems via a data pipeline — not a custom engineering project. The goal is to make threshold definitions and alert routing something an ops manager can configure, not something that requires SQL expertise every time a rule changes.
What data sources do you typically need for business operations SLA monitoring?
For most BFSI operations: loan origination system (LOS), loan management system (LMS), KYC platform, payment processor or mandate management system, and CRM for customer contact history. The key is near-real-time sync from these sources into a unified operational layer.
What makes an SLA alert actionable versus just noise?
Three things: specificity (which transaction, which stage, how long overdue), ownership (routed to the person who can act on it), and context (what's needed to resolve it). A generic "SLA breach detected" notification is noise. A notification that says "Disbursement file #2847 — 22 hours in queue at document review stage, assigned to [name]" is actionable.
Recommended Blogs

5/4/2026
Abhranshu
The Data to Decision Gap: What It Costs and Why It Exists
4/16/2026
AB
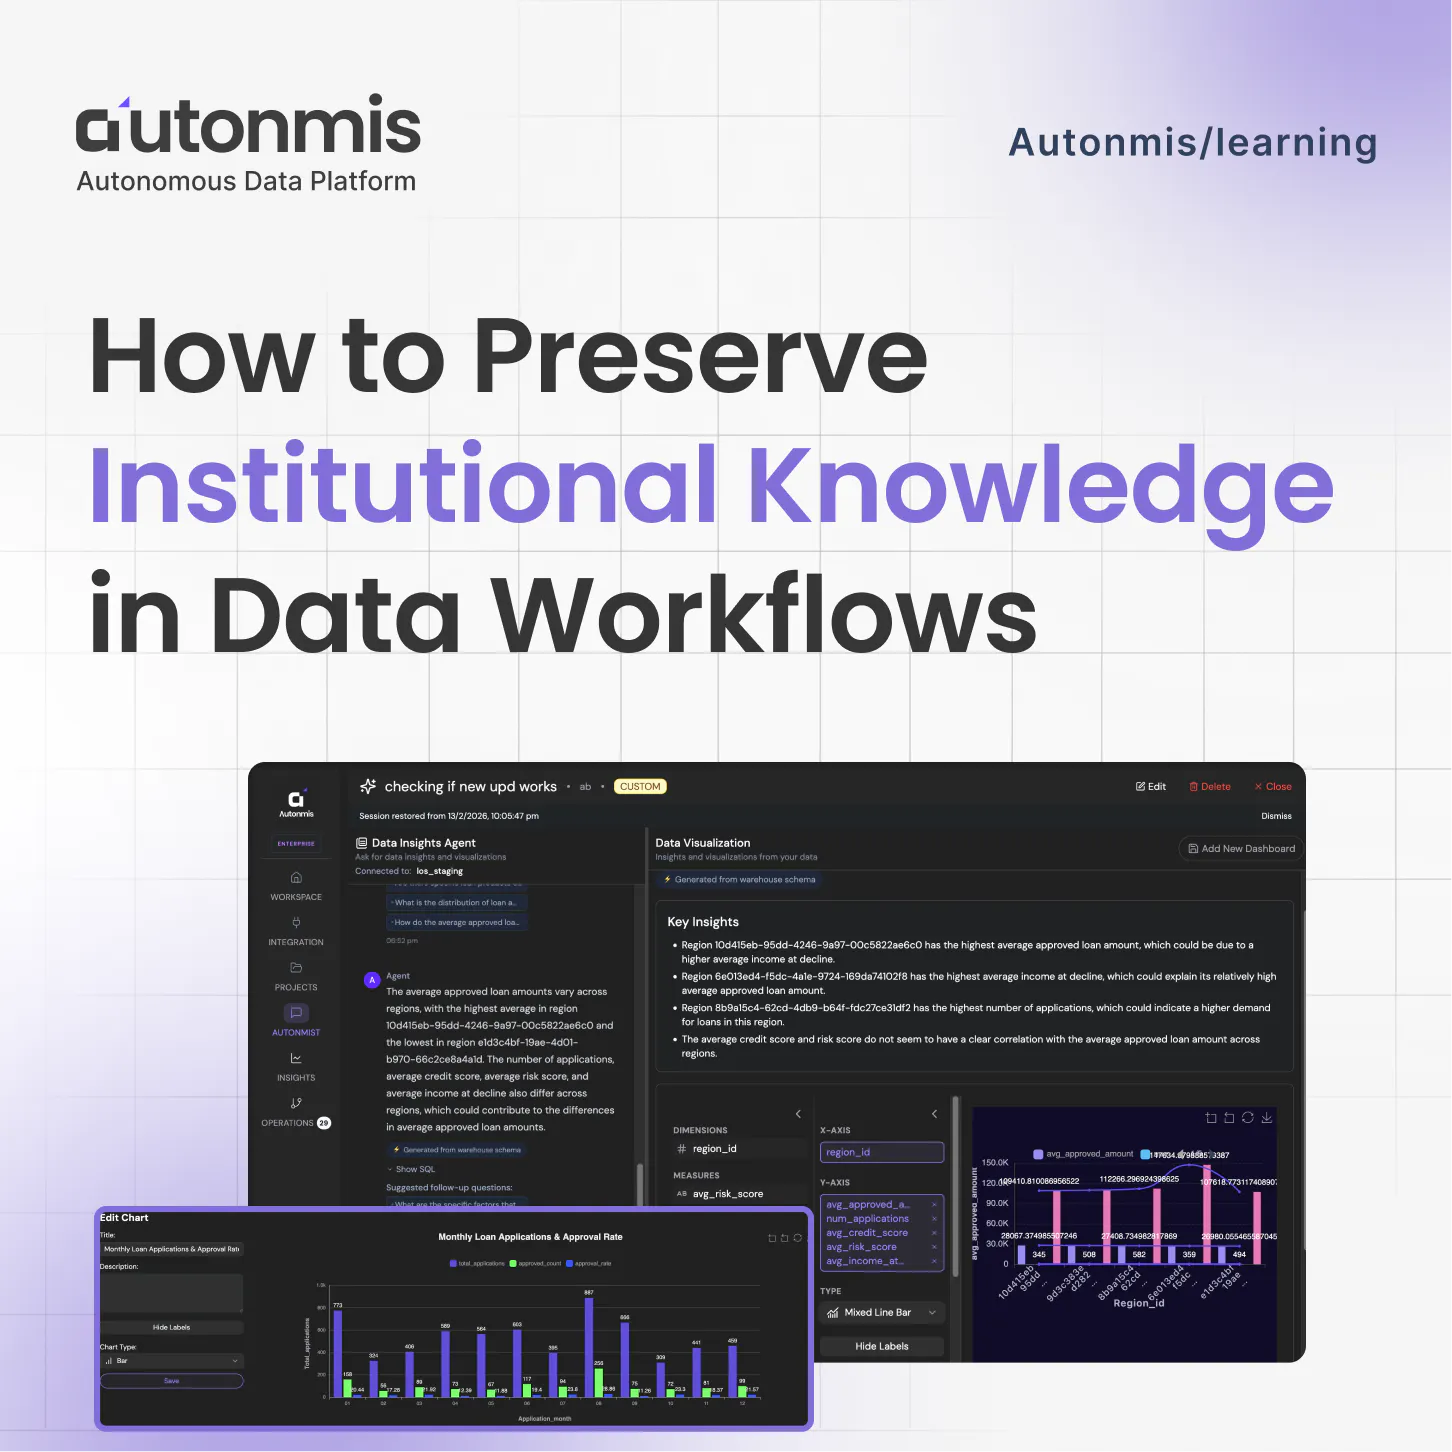
How to Preserve Institutional Knowledge in Data Workflows
Actionable Operations Excellence
Autonmis helps modern teams own their entire operations and data workflow — fast, simple, and cost-effective.