Table of Contents
Why Dashboards Don’t Prevent SLA Breaches
Dashboards reflect past performance but don’t prevent SLA breaches. Explore actionable strategies that ensure reliability and improve operational efficiency.
August 19, 2025

AB

What causes SLA breaches?
SLA breaches happen when a workflow dependency fails, a payment rail goes down, a retry logic fires silently, an escalation path isn't triggered, and nobody finds out until the window has already closed. Dashboards show that a breach occurred. They don't prevent the workflow failure that caused it.
Every ops leader has lived this story:
Your dashboards are green. Metrics look fine. The SLA reports are on track. Yet your team still wakes up to an angry customer email: “You breached your SLA again.”
If dashboards were the answer, this wouldn’t happen. But they aren’t.
Dashboards are mirrors, they reflect the state of your systems. They don’t intervene, they don’t orchestrate, and they definitely don’t save you when pipelines stall at 2 a.m.
So, let’s talk about why Dashboards Don’t Prevent SLA Breaches, and what actually does.
The core argument in one place:
Dashboards are display layers. They reflect the state of your systems at the moment someone opens them. SLA breaches happen in the layer below - in workflows, queues, and retry logic. Preventing breaches requires monitoring and intervening in that layer, not adding more charts on top of it. A company that replaces reactive dashboard monitoring with continuous workflow orchestration typically reduces SLA breach rates by 30-50% in the first operational quarter. (Source: Gartner, "Market Guide for AIOps Platforms", 2024)
Dashboards Are Postmortems in Disguise
Dashboards tell you what already happened. They’re lagging indicators dressed up with beautiful charts.
By the time your dashboard shows SLA risk, the breach is either:
- Already in motion, or
- Averted by sheer human intervention behind the scenes.
High-level leaders don’t need more pretty reports. They need systems that act in real time, not summarize yesterday’s near-misses. True strategies to prevent SLA breaches come from orchestration and automation, not colorful charts.
Breaches Don’t Come from Metrics Alone
SLAs don’t break because a line went red. They break because:
- A credit bureau API slowed down.
- A disbursement job got stuck behind a queue spike.
- An escalation playbook wasn’t triggered on time.
Dashboards don’t solve any of these. They highlight the symptom, not the root cause. Real SLA reliability and preventing SLA breaches, lives in orchestration, failover paths, and automated decisioning, not charts.
Checkout: How Predictive Analytics Improves Operational Efficiency
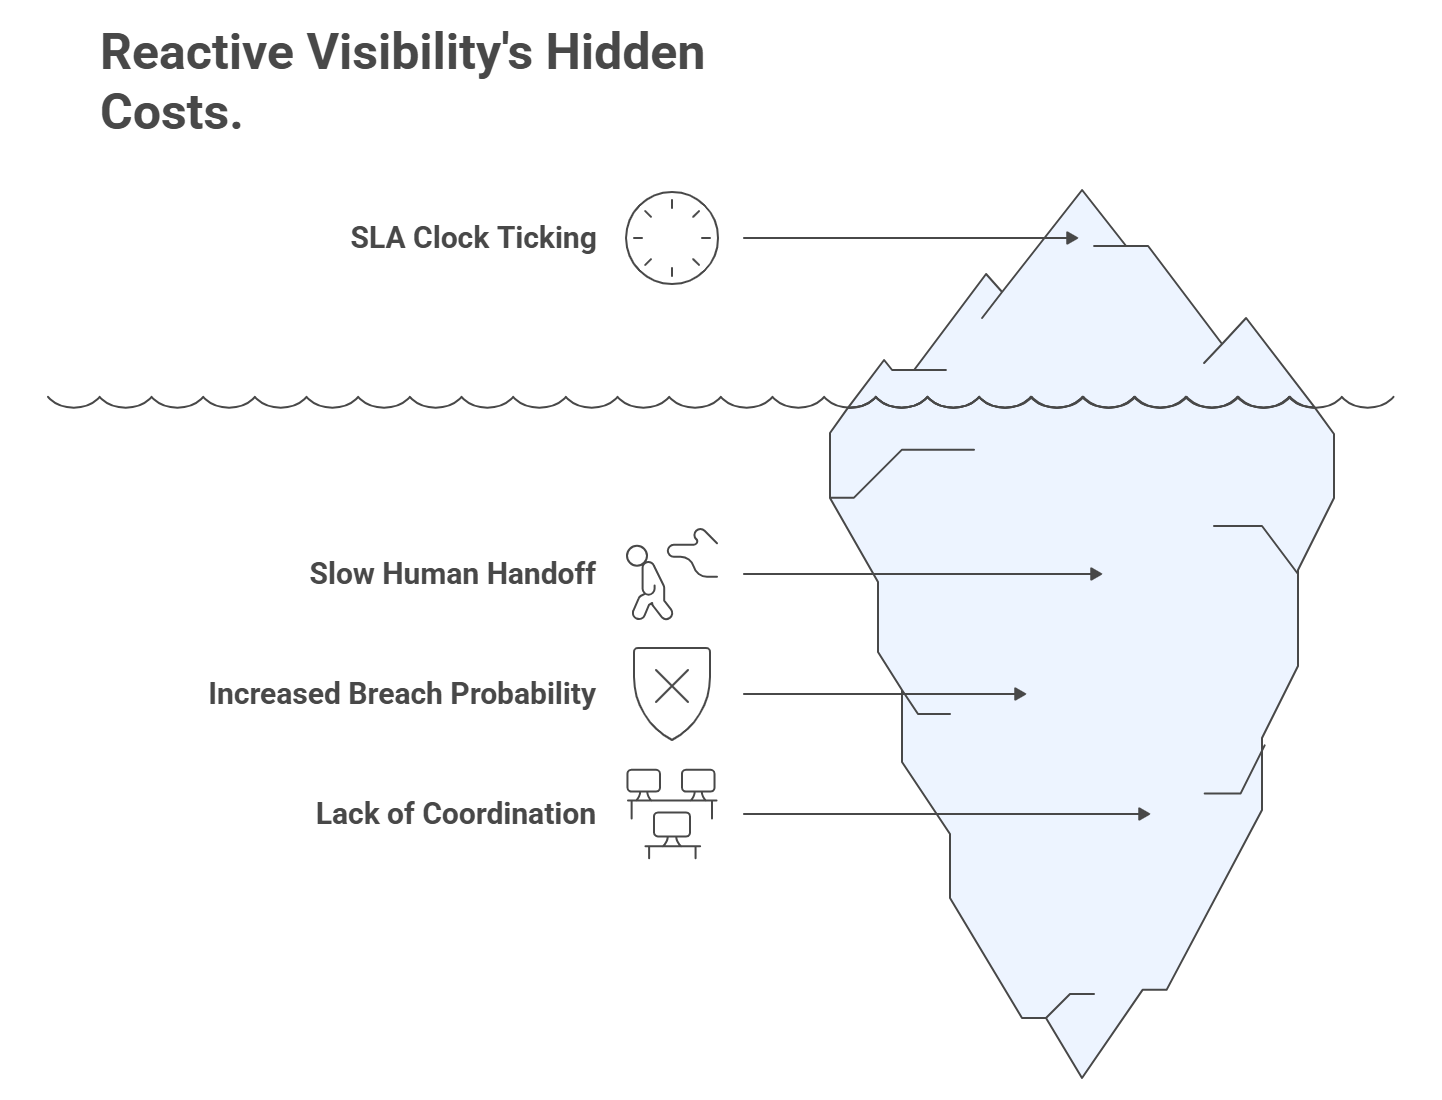
The Hidden Cost of “Reactive Visibility”
Leaders often say: “At least dashboards give us visibility.” True. But visibility without actionability is expensive theater.
Consider this:
- By the time your ops team notices an SLA clock ticking on a dashboard, they’ve already lost valuable minutes.
- The bigger the org, the slower the human handoff: one team notices, another investigates, a third decides.
- Each handoff increases the probability of a breach.
Dashboards centralize attention, but they don’t coordinate response. That gap is where SLA promises die, and why you need better ways to control SLA breaches than reactive visibility.
SLA Breaches Are Workflow Failures, Not Reporting Failures
Think of a loan disbursement SLA. The contract says funds must reach accounts in 30 minutes.
What causes the breach?
- Payment rail congestion.
- Retry logic failing silently.
- No automated rerouting to a backup bank.
The breach doesn’t happen on the dashboard. It happens in the workflow, where dependencies aren’t resilient enough to absorb shocks.
Until workflows themselves are self-healing, dashboards will always be late to the party, which makes them ineffective in preventing SLA breaches on their own.
Dashboards vs Operational Monitoring: What Each Actually Does
Dashboards activate when someone opens them. They show aggregated metrics at the moment of viewing. When a metric turns red, a human has to notice it, decide it is urgent, and start a handoff chain to whoever can investigate. That chain adds minutes or hours before anyone actually touches the problem. At 2am, dashboards do nothing unless someone is watching.
Operational monitoring runs continuously without anyone watching. When a workflow step crosses a threshold, the system catches it, attaches context to it, and routes it to the named owner immediately. The response starts in minutes from the event, not from when someone happens to open a report.
The place where SLA promises are kept or broken is not in the dashboard. It is in the layer below, in queues, retry logic, and workflow dependencies, where dashboards have no reach.
Checkout: What is Operational Intelligence (OI)? Complete 2025 Overview
What Actually Prevents SLA Breaches
Dashboards are necessary, but not sufficient. They’re the scoreboard, not the playbook.
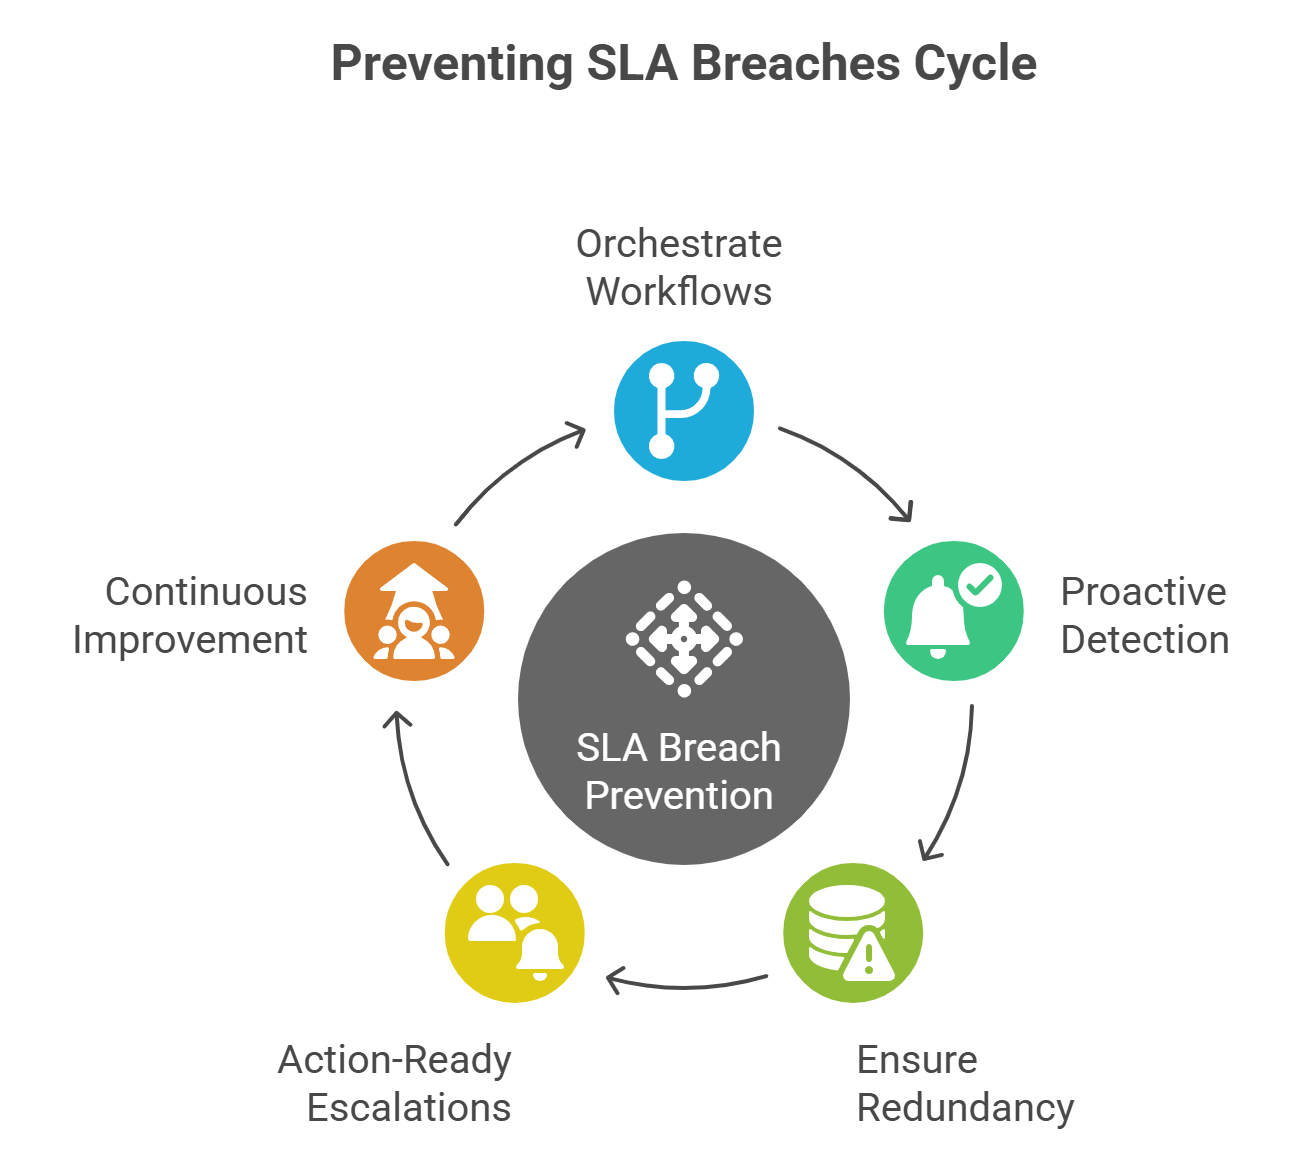
What prevents SLA breaches is a different class of capability: workflow orchestration + automation.
- Orchestration over observation
Systems that reroute tasks when a dependency fails. E.g., if Bank A’s rails are congested, reroute to Bank B automatically. - Proactive detection
Alerts tied to early signals (queue length, API response time) before SLA timers even start burning. - Built-in redundancy
Backup pipelines and alternate API providers ready to go, not discovered during a postmortem. - Action-ready escalations
Not just “Ops dashboard turns red,” but runbooks that auto-trigger: notify the right owner, attach logs, and even start remediation scripts. - Continuous improvement
Each breach analyzed → workflows updated. Not another chart added, but real fixes to retry logic, dependencies, and orchestration.
This is where Autonmis comes in. It is not another dashboard or monitoring layer. It is the infrastructure between your operational data and the people who need to act on it, connecting sources, watching workflows continuously, and routing exceptions to the right owner before the SLA clock runs out.
Dashboards Still Have a Place - But Not This Place
Don’t get me wrong: dashboards matter. They’re great for storytelling, trend analysis, and alignment.
But let’s be clear - they’re for reporting, not prevention.
- Use them to hold retrospectives, align teams, and track improvements.
- Don’t mistake them for safety nets.
Dashboards are the scoreboard. The actual game is played in your pipelines, queues, and orchestration engines, the true ways to control SLA breaches.
Checkout: How to Monitor SLA Breaches in Real Time
Final Word: From Pretty Charts to Real Resilience
If you’re a CTO, Head of Ops, or SRE lead, here’s the uncomfortable truth:
Your SLA reliability will never be solved by another dashboard.
Dashboards make problems visible. Reliability comes from making problems irrelevant, because your systems handled them before customers ever noticed.
The shift is simple but hard: stop asking, “How do we see SLA risks faster?” and start asking, “How do we design workflows so those risks never materialize?”
That’s how you prevent SLA breaches. And no dashboard can do that for you.
Frequently Asked Questions
Why don't dashboards prevent SLA breaches?
Dashboards are passive. They display the state of your systems at the moment you look at them. SLA breaches happen in workflow layers, in failed API calls, stuck queues, and retry logic that fires silently. By the time a dashboard shows SLA risk, the breach is often already in progress. Prevention requires monitoring at the workflow level and automated routing when thresholds are crossed, not better charts.
What is the difference between a dashboard and an operational monitoring system?
A dashboard is a display layer, it shows you aggregated data someone has already processed. An operational monitoring system watches live events continuously, applies business rules, and surfaces exceptions to the right person with context attached. The key difference: dashboards require a human to go look at them. Operational monitoring finds the human when something needs attention.
What actually prevents SLA breaches in lending operations?
Three things prevent SLA breaches in lending ops: workflow orchestration that reroutes tasks when a dependency fails, proactive detection tied to early signals (queue length, API response time) before the SLA clock starts burning, and automated escalation that routes the right context to the right owner without waiting for a human to notice a red metric on a chart.
How much does reactive monitoring cost compared to proactive monitoring?
The cost of reactive monitoring is mostly invisible until it compounds. A stuck disbursement discovered from a dashboard review 4 hours later is a customer complaint and a manual investigation. The same exception caught by automated monitoring at the moment it happens is a 10-minute fix. In high-transaction environments, Gartner estimates that teams using proactive operational monitoring reduce SLA breach incidents by 30-50% compared to dashboard-dependent approaches.
Can you use dashboards and operational monitoring together?
Yes - and that's the right approach. Dashboards serve a different purpose: trend analysis, leadership communication, and historical review. Operational monitoring handles the real-time exception layer. The mistake is using dashboards as the primary tool for prevention when they were built for reporting. Use both, but be clear about what each one is actually for.
Recommended Blogs
5/4/2026
Abhranshu
The Data to Decision Gap: What It Costs and Why It Exists
4/16/2026
AB
How to Preserve Institutional Knowledge in Data Workflows
Actionable Operations Excellence
Autonmis helps modern teams own their entire operations and data workflow — fast, simple, and cost-effective.