5/3/2025

AB
What Is Univariate Analysis? How to Use It in Data Exploration
What is univariate analysis — and why should every data scientist care? Discover how exploring one variable at a time can reveal hidden insights, catch data issues early, and set the stage for smarter models.
I've come to appreciate the profound importance of univariate analysis in my data science work. While it might not sound exciting at first glance, this fundamental approach truly deserves more recognition.
If univariate analysis were at a data science party, it would be standing in the corner while flashier techniques like neural networks and random forests capture everyone's attention. Yet this seemingly humble approach forms the essential foundation of any worthwhile data exploration effort, providing critical clarity before you venture into more complex analytical territory.
What is univariate analysis, why is it important and how to perform it - let's find out the answers to these questions all in one go.
The Foundation That Can't Be Skipped
Univariate analysis involves examining a single variable in isolation to understand its fundamental properties—without considering relationships to other variables. It's purely descriptive, focusing on what the data looks like rather than why it behaves that way.
But don't let this simplicity fool you. Without a thorough understanding of each individual variable in your dataset, you can't responsibly analyze correlations, build time series models, or perform multivariate analyses. If you skip univariate analysis, you're building everything else on shaky foundations.
I learned this lesson the hard way back in 2018, when our team spent weeks building a customer segmentation model that completely fell apart in production. Why? Because we hadn't noticed that our income data was severely skewed, with several impossible values throwing off our entire clustering approach. A simple histogram would have saved us weeks of work.
Key Components of Univariate Analysis
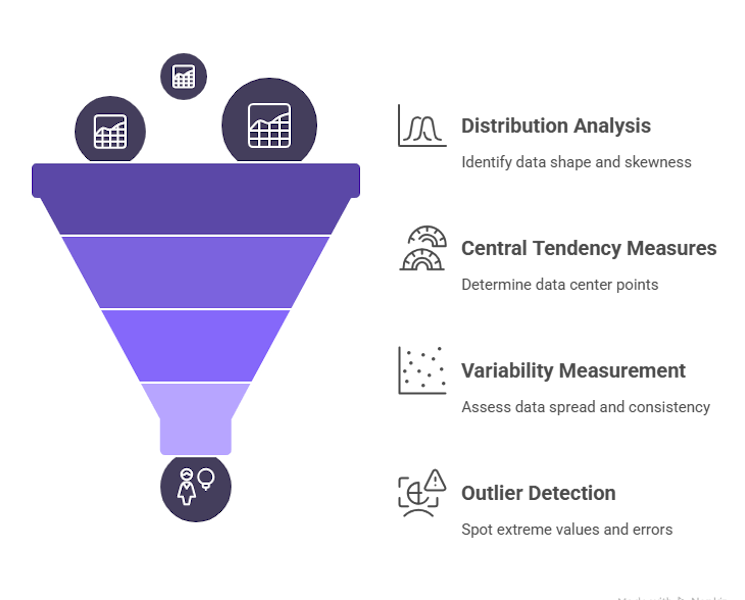
Every robust univariate analysis explores four fundamental aspects of your data:
1. Distribution Analysis
This reveals the shape of your data—identifying skewness, modality, and potential need for transformation. A histogram often tells you more about your data in seconds than hours of algorithmic exploration.
For example, discovering that your customer age data has a strong positive skew might lead you to apply logarithmic transformation before modeling, dramatically improving your predictive accuracy.
2. Central Tendency Measures
Understanding where your data "centers" through mean, median, and mode provides a crucial orientation point. When these three measures diverge significantly, it's often your first signal that the data requires special handling.
The mean tells you the arithmetic average, but can be sensitive to outliers. The median gives you the middle value when data is ordered, providing robustness against extreme values. The mode shows you the most common value—particularly useful for categorical data.
3. Variability Measurement
How spread out is your data? Quantifying spread via range, variance, standard deviation, and interquartile range (IQR) helps you understand data stability and consistency.
A high standard deviation relative to the mean might indicate high volatility in customer spending, while a tight IQR could suggest consistent behavior within your core customer segment.
4. Outlier Detection
Spotting extreme values that may indicate errors or important rare events is crucial before any modeling. Outliers can dramatically skew results and lead to faulty conclusions if not identified early.
Finding that one store location has 50x the typical transaction value might reveal a data entry error—or a high-value corporate account that deserves special attention.
Key Components of Univariate Analysis
Checkout: The Rise of Generative BI Platforms: What It Means for Data Teams
Why Univariate Analysis Matters for Business
Data Quality and Trust
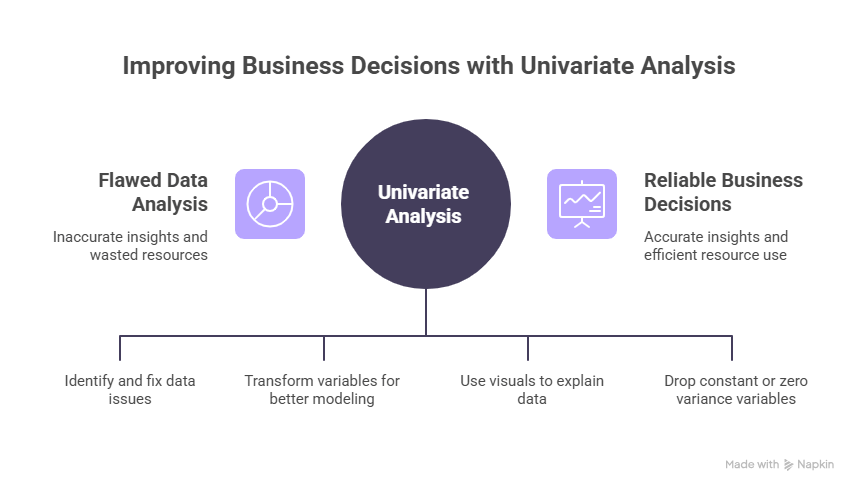
Early identification of impossible or missing values—such as negative ages or blank categories—prevents flawed downstream analyses. When a VP asks why last quarter's model failed, the answer often traces back to data issues that univariate analysis would have caught.
As data teams know all too well, fixing issues early costs a fraction of what it takes to recover from a flawed analysis presented to stakeholders.
Efficient Feature Engineering
Data rarely comes in perfect form for analysis. Skewed or heavy-tailed variables can be transformed (e.g., logarithmic scaling) to satisfy model assumptions, improving predictive accuracy and interpretability.
Univariate analysis reveals which transformations are needed, preventing the common "throw every transformation at the wall and see what sticks" approach that wastes computational resources.
Stakeholder Alignment
Simple, intuitive visuals like histograms and boxplots communicate data health to non-technical executives, building confidence in your analytics roadmap. As one CDO put it, "I can explain a histogram to the board in 30 seconds; I can't do that with a complex model."
Resource Optimization
Variables with zero variance or constant values (like that "High" confidence flag that never changes) can be dropped early, reducing data processing loads and speeding up model training.
Why Univariate Analysis Matters for Business
Practical Implementation: A Python Walkthrough
Let's actually implement univariate analysis on a real dataset. We'll use Python with common data science libraries to explore restaurant visit data with associated weather conditions.
First, let's set up our environment and import the necessary libraries:
python
Analyzing Numerical Variables
Now let's explore the numerical columns in our dataset:
python
Next, let's examine our categorical variables. These often tell an entirely different story:
When I ran this on the restaurant visit dataset, I discovered several interesting things:
- The CONFIDENCE_SCORE was "High" for 100% of records - completely useless for analysis and an immediate candidate for dropping. I've wasted time before including non-informative variables in models!
- CITY_NAME showed Denver representing 67.3% of all records, with Chicago and Dallas making up the rest. This geographic imbalance means we need to be careful about generalizing results nationwide.
- While SOURCE looked innocent enough, the "1P" (first-party) data had systematically different patterns than "3P" (third-party) data, potentially introducing bias into our analysis. I discovered this only after splitting metrics by SOURCE.
Checkout: What is ELT? Understanding Modern Data Transformation
Moving Beyond Univariate Analysis
With this solid foundation established, we're now equipped to venture into more sophisticated analytical territory. I've found that the insights from univariate analysis naturally guide these next steps:
Bivariate Analysis: Finding Relationships
Now I can thoughtfully pair variables based on what I learned. For example, after seeing that VISIT_DURATION has that extreme right skew (with an alarming skewness value of 12.3 in our data), I know to log-transform it before examining its relationship with TEMPERATURE or CHAIN_NAME.
When I tried this approach last year with a retail dataset, I found remarkable seasonal patterns that would have been completely obscured had I not addressed the distribution issues first. The insights were compelling enough that our marketing team completely restructured their campaign calendar around them.
Feature Engineering Informed by Data Reality
Understanding the true nature of each variable opens up creative feature engineering possibilities:
- Those zero-inflated variables like SNOW_DEPTH might be more useful as binary flags (SNOW_PRESENT)
- I could create bucketed versions of highly skewed variables
- When I saw the HUMIDITY distribution was bimodal (two distinct humps), I created a binary feature that significantly improved our model's performance
The possibilities multiply when you truly know your data.
Building Models That Actually Work
My colleagues often wonder why their sophisticated models perform no better than simple ones. The secret lies in how well they understand their variables before modeling.
For instance, one data scientist on our team was struggling with a customer churn model until we revisited his univariate analysis. We discovered that one of his "predictive" features actually had a uniform distribution of random values—essentially noise that the model was overfitting to. Removing it immediately improved his results.
Communicating Insights That Resonate
Perhaps most importantly, univariate analysis makes your findings infinitely more communicable to business stakeholders. When presenting to our executive team last quarter, I opened with four simple histograms that instantly conveyed why customer behavior varied so dramatically by region. The executives immediately grasped the implications because they could literally see the differences in the distributions.
Enterprise Best Practices
For organizations serious about data-driven decision making, consider these univariate analysis best practices:
Automate Profiling
Integrate univariate checks into ETL/ELT jobs using data quality frameworks (like Great Expectations) to enforce thresholds on null rates, variance, and skewness. This allows early detection of data issues before they impact downstream analyses.
Version Your Reports
Store historical univariate summaries in your data catalog to detect data drift—crucial for regulated industries like finance and healthcare where model monitoring is required.
Standardize Templates
Develop branded visualization templates with consistent colors, fonts, and layouts for executive reporting. This subtly reinforces data literacy across your organization while making insights more digestible.
Document Findings
Share interactive notebooks with annotations to align data, analytics, and business teams on dataset readiness. This documentation becomes invaluable when onboarding new team members or revisiting analyses months later.
Checkout: Understanding Stationarity in Time Series Data: Why It Matters
Conclusion: The Unsung Hero of Data Science
Univariate analysis may be the simplest analytical technique, but the importance of univariate analysis cannot be overstated. By thoroughly understanding each variable before attempting more complex analyses, you build a solid foundation for all your data science work.
Remember that even the most sophisticated machine learning algorithms can't compensate for poor understanding of your individual variables. Take the time to perform comprehensive univariate analysis—your insights, models, and business decisions will be dramatically better for it.
Whether you're a data scientist starting a new project, an analyst exploring an unfamiliar dataset, or a business leader wanting to understand the quality of your data assets, univariate analysis is your essential first step on the path to trustworthy, actionable insights.
Univariate analysis is your data’s first line of defense—make it effortless with Autonmis:
- A Unified Data Platform means your histograms, boxplots, and stats live in one Business Intelligence Platform—no tool-hopping.
- Natural Language Data Queries let you chat with your data: “Show me order amount skewness,” and voilà!
- Gen BI features automate summary insights and transformation suggestions.
- Collaborative Data Analytics gives your teammates real-time access to univariate reports, complete with comments and version history.
- Data Pipeline Orchestration ensures univariate checks run automatically before any model training.
Experience the future of data analysis with Autonmis.
Recommended Learning Articles
5/30/2026
AB
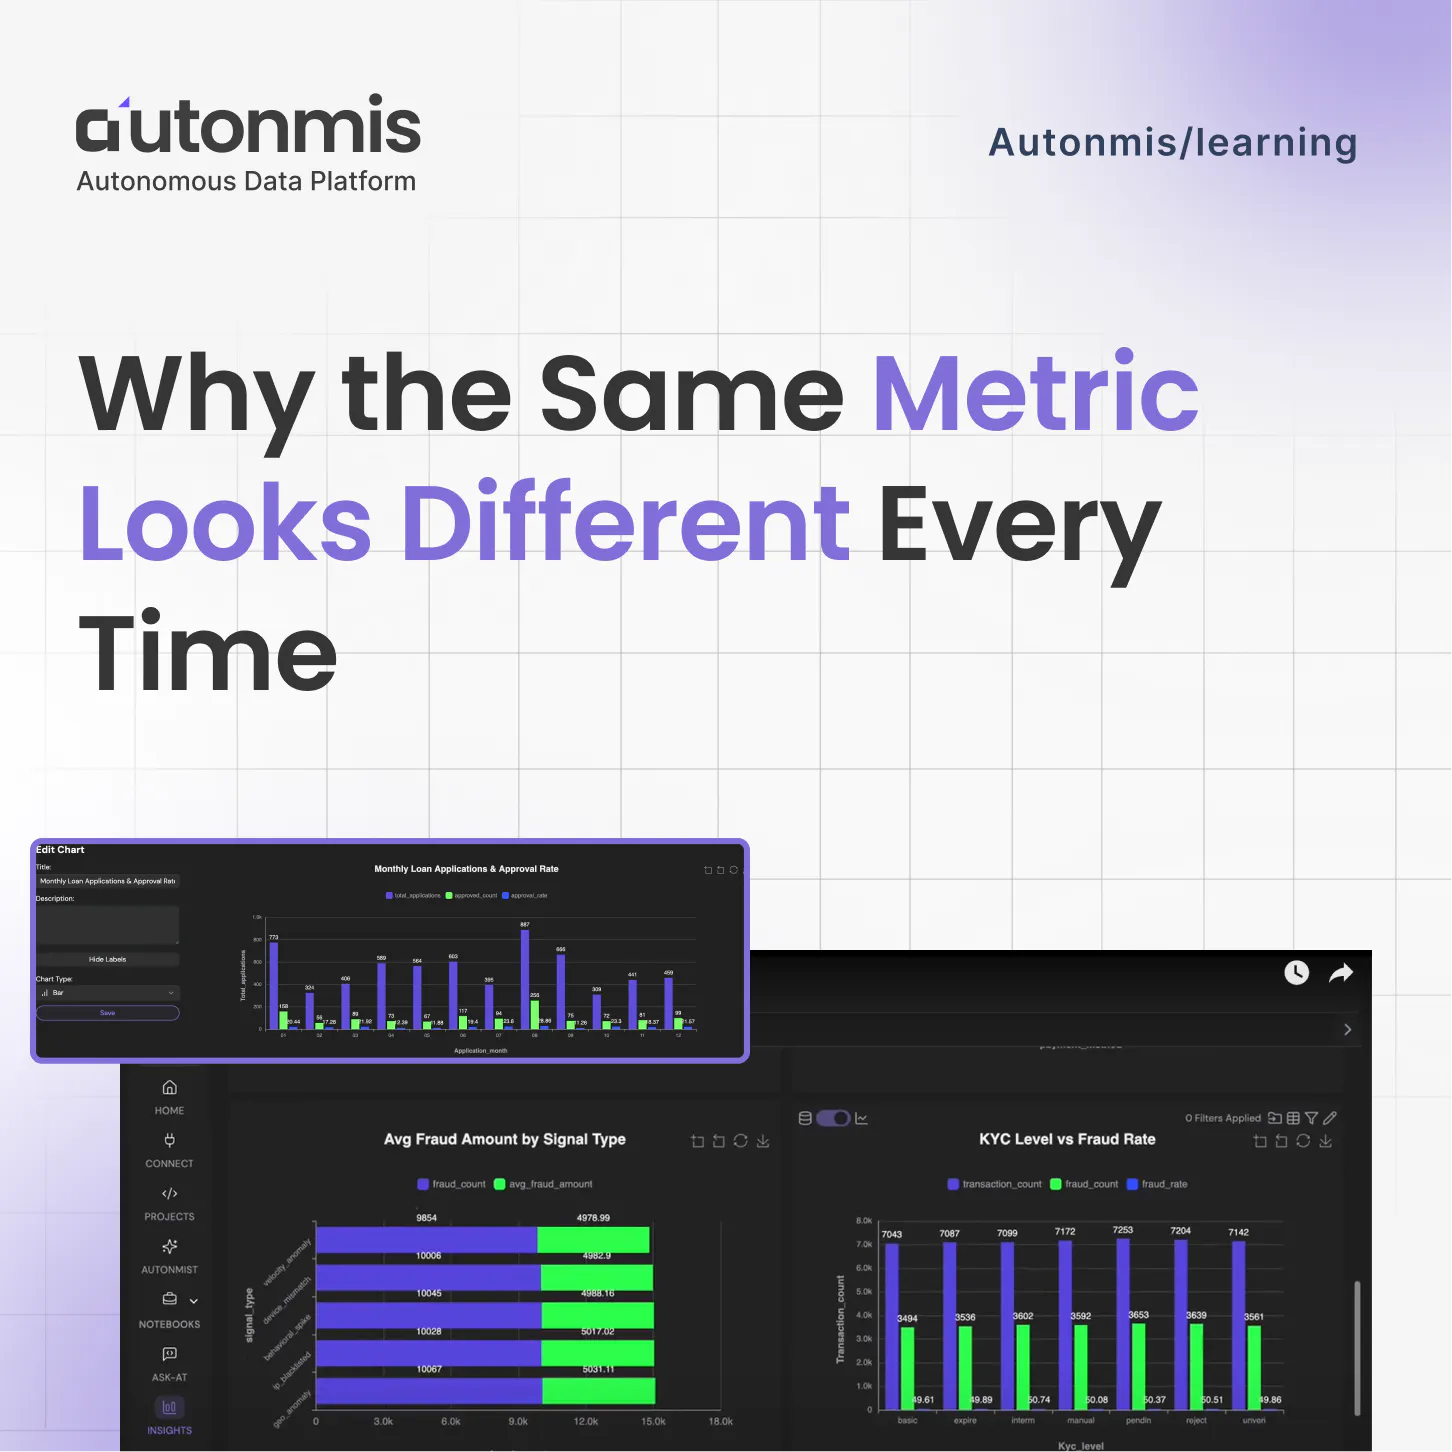
Why the Same Metric Looks Different Every Time
4/9/2026
AB
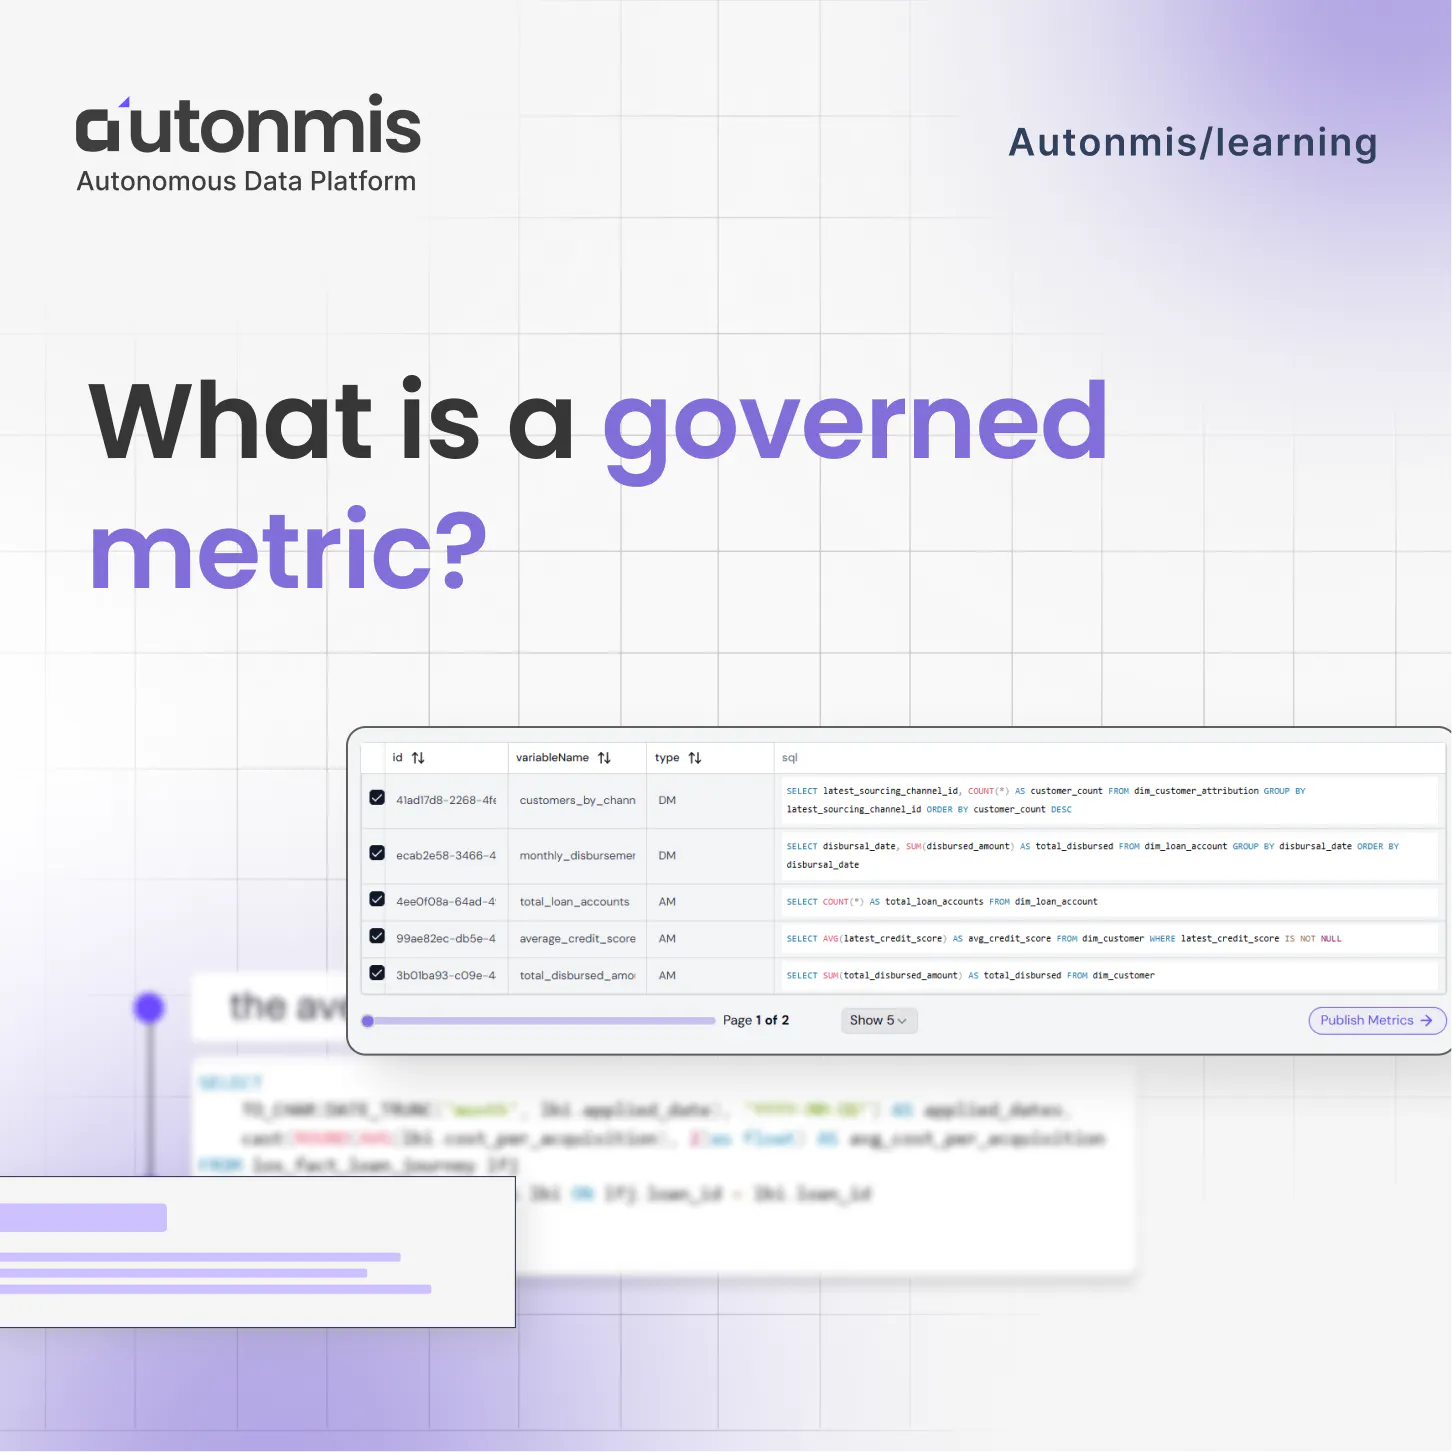
What is a governed metric?
Actionable Operations Excellence
Autonmis helps modern teams own their entire operations and data workflow — fast, simple, and cost-effective.