Table of Contents
The Rise of Generative BI Platforms: What It Means for Data Teams
Generative BI platforms are changing how organizations interact with data by making analytics more accessible and intuitive. From reducing manual work for data teams to enabling real-time decision-making for business users, we look at the key differences from traditional BI, real-world examples, and what this shift means for the future of data work.
April 26, 2025

AB
Generative Business Intelligence (BI) platforms apply large language models (LLMs) and other generative AI to analytics workflows. In short, “Gen BI” extends traditional BI by allowing users to query data in plain English (or business terms) and get charts, tables, or descriptions, all generated automatically.
Instead of writing SQL or building dashboards by hand, users can ask a question – for example, “show me a pie chart of our top 5 products by sales last quarter” – and the system analyzes the data and returns exactly that chart. The goal is to automate and accelerate routine data tasks (pattern detection, visualization, summarization) so anyone can gain insights without needing coding skills.
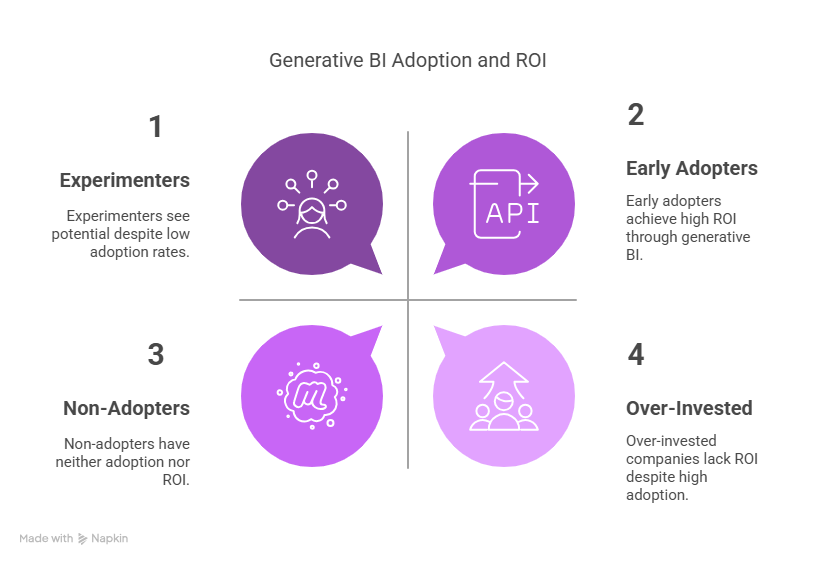
Generative BI is still an emerging field. According to IBM, only about 3% of organizations have fully deployed gen BI, though over half are experimenting with it. Early adopters report significant benefits: one Snowflake survey found a 41% average ROI on generative AI efforts, driving more investment in data platforms and LLMs.
In short, companies are hungry to tap generative AI’s promise of self-service analytics – letting users across the organization get data-driven answers instantly – and BI vendors are racing to deliver it.
How Generative BI Differs from Traditional BI
Traditional BI platforms require technical steps – writing SQL or MDX, crafting joins, setting up charts – which makes them powerful but often siloed and slow. Generative BI, by contrast, is user-centric and conversational:
- Natural language input: Users simply describe what they want (“show sales by region”), instead of writing code or configuring queries. Generative BI systems parse the request using AI and translate it into the right data queries behind the scenes.
- Automated content generation: Charts, dashboards, summaries and even written narratives are produced on-the-fly. The tool identifies trends, groups, or outliers automatically, whereas in traditional BI analysts had to script every step.
- Broader audience: Non-technical stakeholders – managers, marketers, etc. – can interact directly with data. Self-service analytics is democratized because generative BI eliminates the need to learn specialized tools.
- Iterative Q&A: With tools like conversational chatbots (e.g. embedded in dashboards), users can ask follow-up questions or clarifications just like talking to a colleague, and get updated results instantly.
- Continuous learning: Many generative BI platforms learn from user behavior. They adapt to company-specific terminology and data semantics over time (e.g. Tableau GPT leverages VizQL and learns from user questions).
In practice, this means faster insight cycles. A report by Pyramid Analytics notes that traditional BI often leaves data “trapped in the data” due to complicated interfaces, while generative BI aims to put insights into everyone’s hands.
Generative BI vs Traditional BI
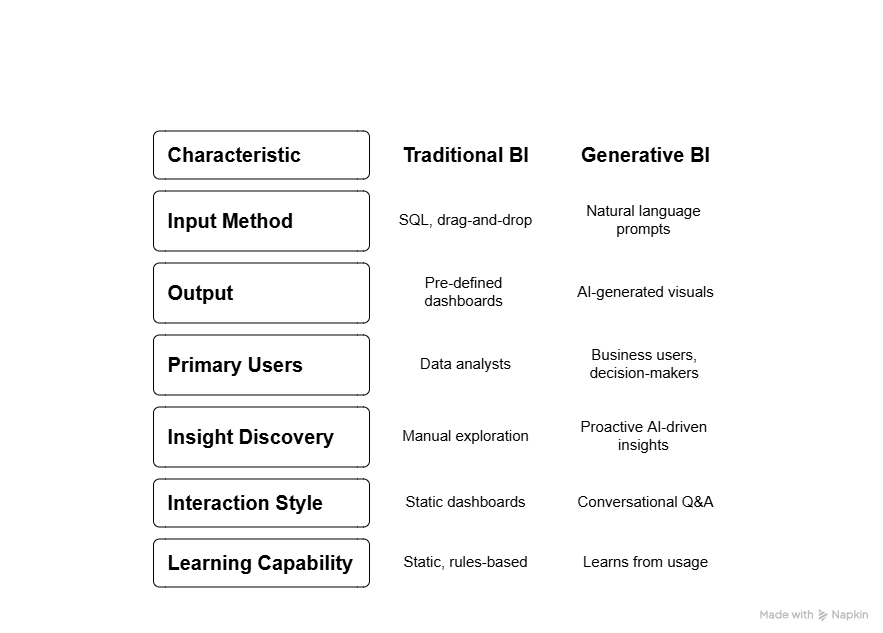
Generative BI doesn’t replace traditional BI—it builds on it, simplifying complex analysis for non-technical users and accelerating workflows for analysts.
A Side-by-Side Scenario
To truly understand the transformational power of generative business intelligence (BI), let’s consider a practical scenario:
Scenario: A regional sales manager wants to analyze the top-performing products in the last quarter.
Traditional BI Approach:
- Data Retrieval: The manager contacts the data team to request a report.
- Query Development: A data analyst writes SQL queries to extract sales data, filters it by date, and aggregates it by product.
- Visualization: The analyst imports the data into a visualization tool like Tableau or Power BI to create charts.
- Report Generation: The final report is generated and sent back to the manager.
- Timeframe: This process can take several days, depending on the data team's workload.
Generative BI Approach:
- Natural Language Query: The manager types, "Show me the top 5 products by sales in the last quarter" into the Generative BI platform.
- Instant Response: The platform processes the request using AI, retrieves the relevant data, and generates an interactive chart.
- Immediate Insight: The manager receives the visualization within seconds and can further interact with the data by asking follow-up questions.
- Timeframe: The entire process is completed in real-time, empowering the manager to make swift, data-driven decisions.
This comparison highlights how Generative BI democratizes data access, reduces dependency on specialized teams, and accelerates decision-making processes.
Impact on Data Teams
According to Databricks, features like Databricks Assistant or AI/BI Dashboards let analysts generate code and visuals faster (e.g. generating SQL from conversational prompts, or using AI to auto-layout a dashboard).
Mode Analytics’s AI Assist offers a similar experience: an analyst types a natural-language comment (e.g. --! total sales by manager) and the tool fills in the full query using GPT-4.
For data teams, this frees up time to focus on higher-value work. Instead of acting as report-generating technicians, analysts can shift toward interpretation, modeling, and strategy.
The industry sees three “collaborators” emerging: the domain expert, the data expert, and the AI assistant. In other words, an analyst’s role evolves from hand-coding everything to guiding the AI – designing prompts, validating results, and refining outputs. For example:
- Workflow automation: Data engineers and analysts can use generative BI features (like Copilot in Microsoft Fabric or AWS QuickSight) to automate data preparation and transformation steps. Copilot can generate or explain complex DAX/T-SQL code for Power BI and Synapse, or even suggest fixes in a query editor. This means fewer manual data-pipeline chores.
- Expanded reach: Business users can perform exploratory analysis themselves. With tools like Conversational Analytics in Google Looker (Gemini) or QuickSight Q, non-analysts can chat with data in real time. Data teams may see fewer small ad-hoc requests and instead collaborate on strategic projects, trusting the AI to handle front-line queries.
- New skills: Teams will need prompt-engineering and AI literacy. Just as analysts learned SQL, they now need to understand LLM behavior (e.g. how to phrase prompts, check AI-generated SQL for correctness). Knowledge of AI model governance and data quality becomes critical, since automated insights are only as good as the data and prompts behind them. Organizations like Microsoft emphasize responsible use – e.g. adding guardrails in Copilot for Fabric to secure data while using generative features.
Productivity can spike. Vendors claim time-to-insight can improve by several-fold: for instance, one marketing page cites “4x faster analysis” with generative AI (and a 25% lift in decision accuracy). (Even if these figures vary by use case, they underscore the potential uplift.)
In this illustration, an analyst sends a natural language prompt to a Chat API (simulating a generative BI tool). The model returns an SQL query tailored to the request, which can then be run against the database. This kind of workflow – essentially built into Mode AI Assist, Databricks Assistant, and others – shows how data teams can leverage LLMs directly in code.
Real-World Examples
Leading BI and cloud providers are rapidly adding generative features. Here are some notable examples in 2024–2025:
- ThoughtSpot Sage: A search-driven analytics platform, ThoughtSpot already enabled users to type in questions. Its Sage update supercharges this with generative AI. Customers like Electronic Arts and easyJet report that Sage lets any stakeholder ask questions in natural language and get instant answers, with visuals that can be pinned to dashboards. In practice, users can type “analyze my product performance” or similar prompts and ThoughtSpot Sage will build the relevant charts or tables automatically.
- Mode + GPT-4 (Mode AI Assist): Mode Analytics (recently acquired by ThoughtSpot) offers AI Assist in its SQL/Notebook environment. Analysts can insert special comments (e.g. --! describe quarterly revenue) and Mode will call GPT-4 to write the SQL or Python query for them. This means analysts can prototype queries by describing results in English, then tweak the generated code. Mode’s integration exemplifies how generative BI can be embedded directly in data tools to speed query authoring.
- Tableau GPT and Pulse: Salesforce’s Tableau has added generative features (sometimes branded Tableau GPT or Einstein AI). Users can now “ask questions within Tableau” or use Tableau Pulse to get proactive, automated insights. For example, Tableau GPT layers generative AI on top of its VizQL engine to translate questions into queries, and outputs can be visuals or even written data stories. Tableau Pulse (enabled by GPT) surfaces personalized metrics in natural language, helping business teams stay informed. In short, Tableau’s generative AI aims to make data feel “like a colleague that has your back,” feeding users insights they might not know to ask for.
- Autonmis: Autonmis offers a conversational data workspace that unifies pipelines, notebooks, and dashboards. Users can build data workflows by simply conversing with the platform, eliminating the need for multiple tools and specialist teams. Autonmis's AI-native platforms allow for the creation of data pipelines, analyses, and dashboards through natural language interactions, streamlining the data management process.
Comparing Traditional BI Tools with Autonmis (Gen BI Tool)
Traditional BI tools like Tableau, Power BI, and Qlik have been instrumental in data visualization and reporting. However, they often require specialized knowledge in SQL, data modeling, and dashboard creation.
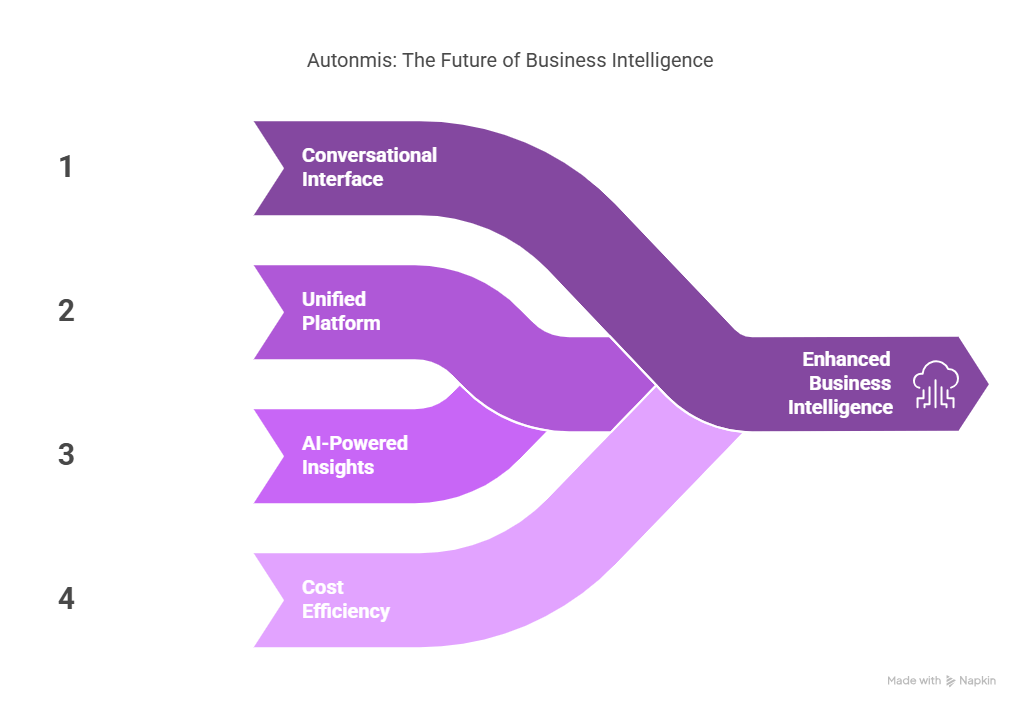
Autonmis redefines this approach by offering:
- Conversational Interface: Users can interact with data using natural language, reducing the learning curve and dependency on technical teams.
- Unified Platform: Combines data ingestion, processing, and visualization in one platform, eliminating the need for multiple tools.
- AI-Powered Insights: Automatically generates insights and narratives, enabling faster decision-making.
- Cost Efficiency: By reducing the need for multiple tools and specialized personnel, Autonmis can lower the total cost of ownership
Conclusion
In summary, generative BI platforms are empowering data teams to deliver faster, richer insights by automating low-level work and enabling natural-language interaction. Data professionals who adapt – by strengthening data architecture, embracing AI tools, and developing prompt and oversight skills – will find they can amplify their impact. As ThoughtSpot’s CEO puts it, we’re entering a “Data Renaissance” where AI accelerates analytics, but with humans “firmly behind the steering wheel”. The time to prepare is now: by exploring these platforms today, data teams can build the momentum and expertise needed to thrive in the next generation of BI.
Recommended Blogs
5/4/2026
Abhranshu
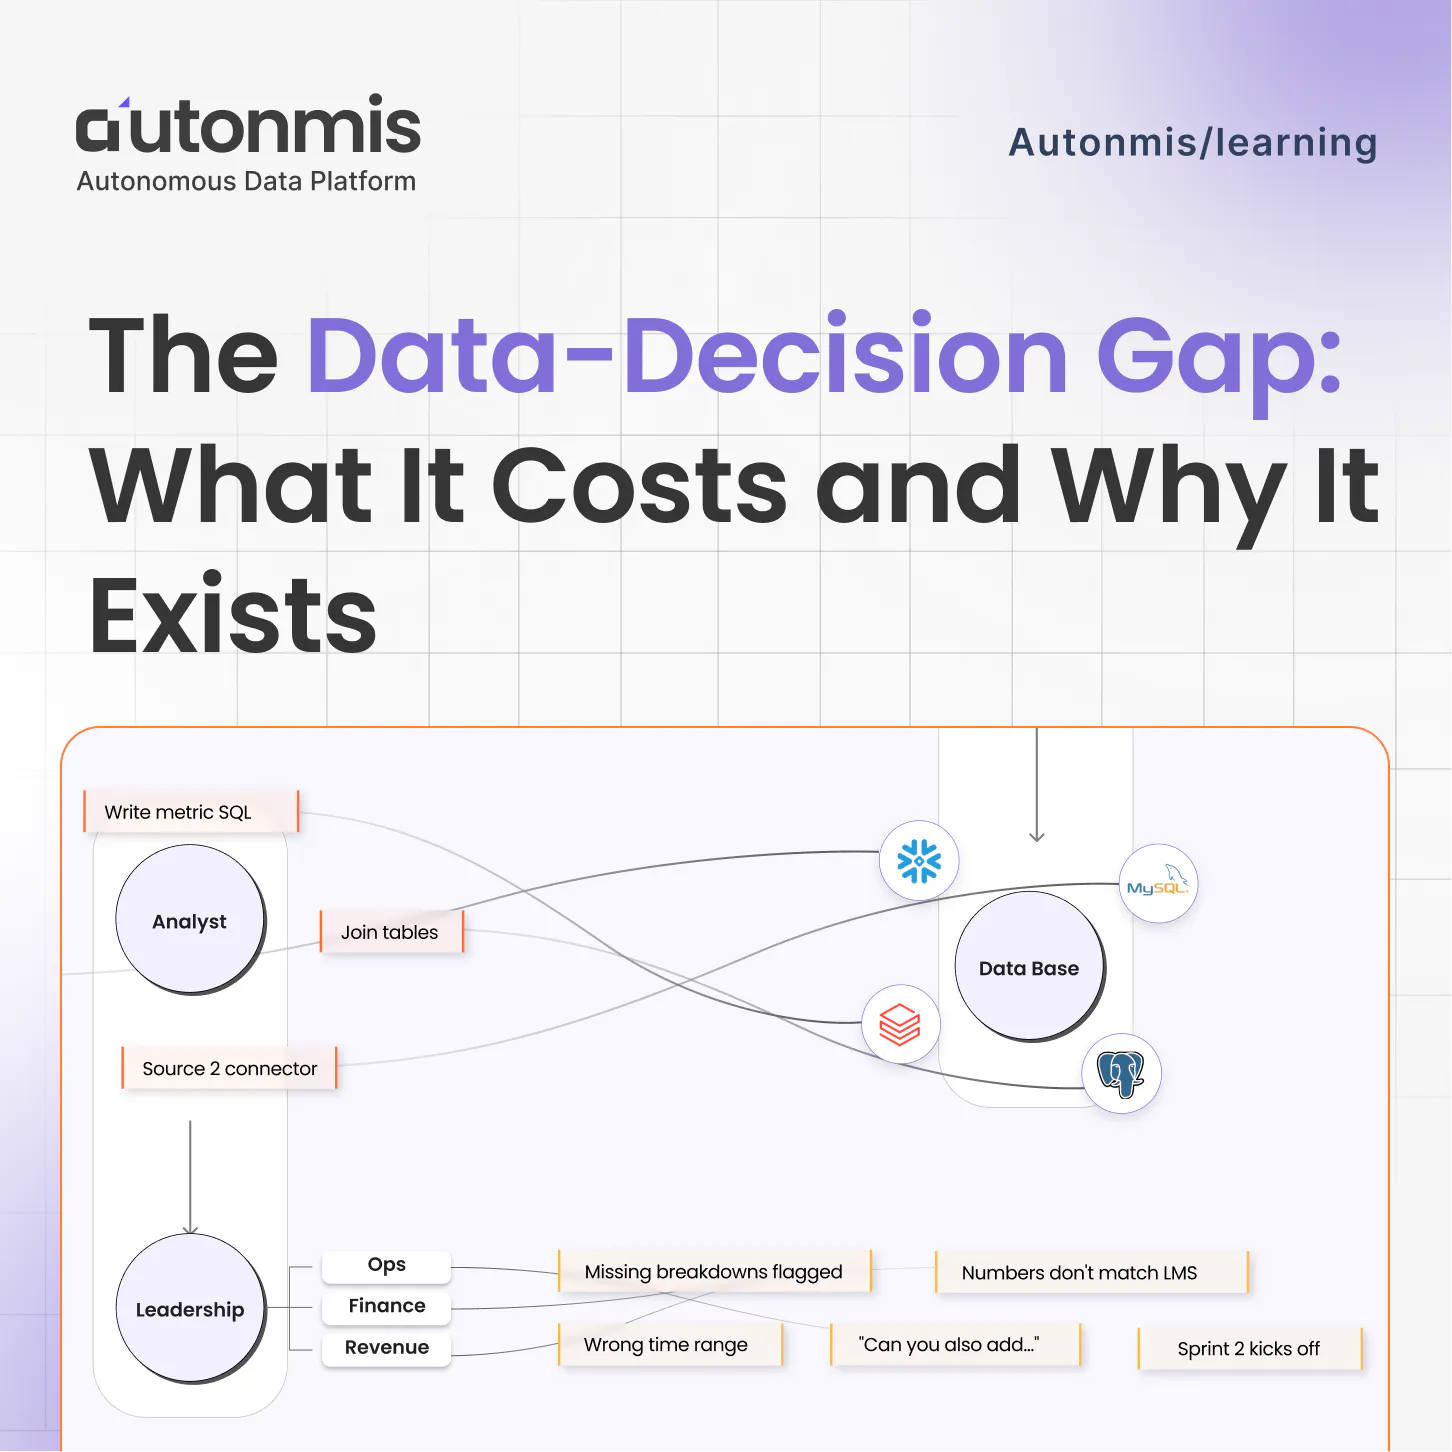
The Data to Decision Gap: What It Costs and Why It Exists
4/16/2026
AB
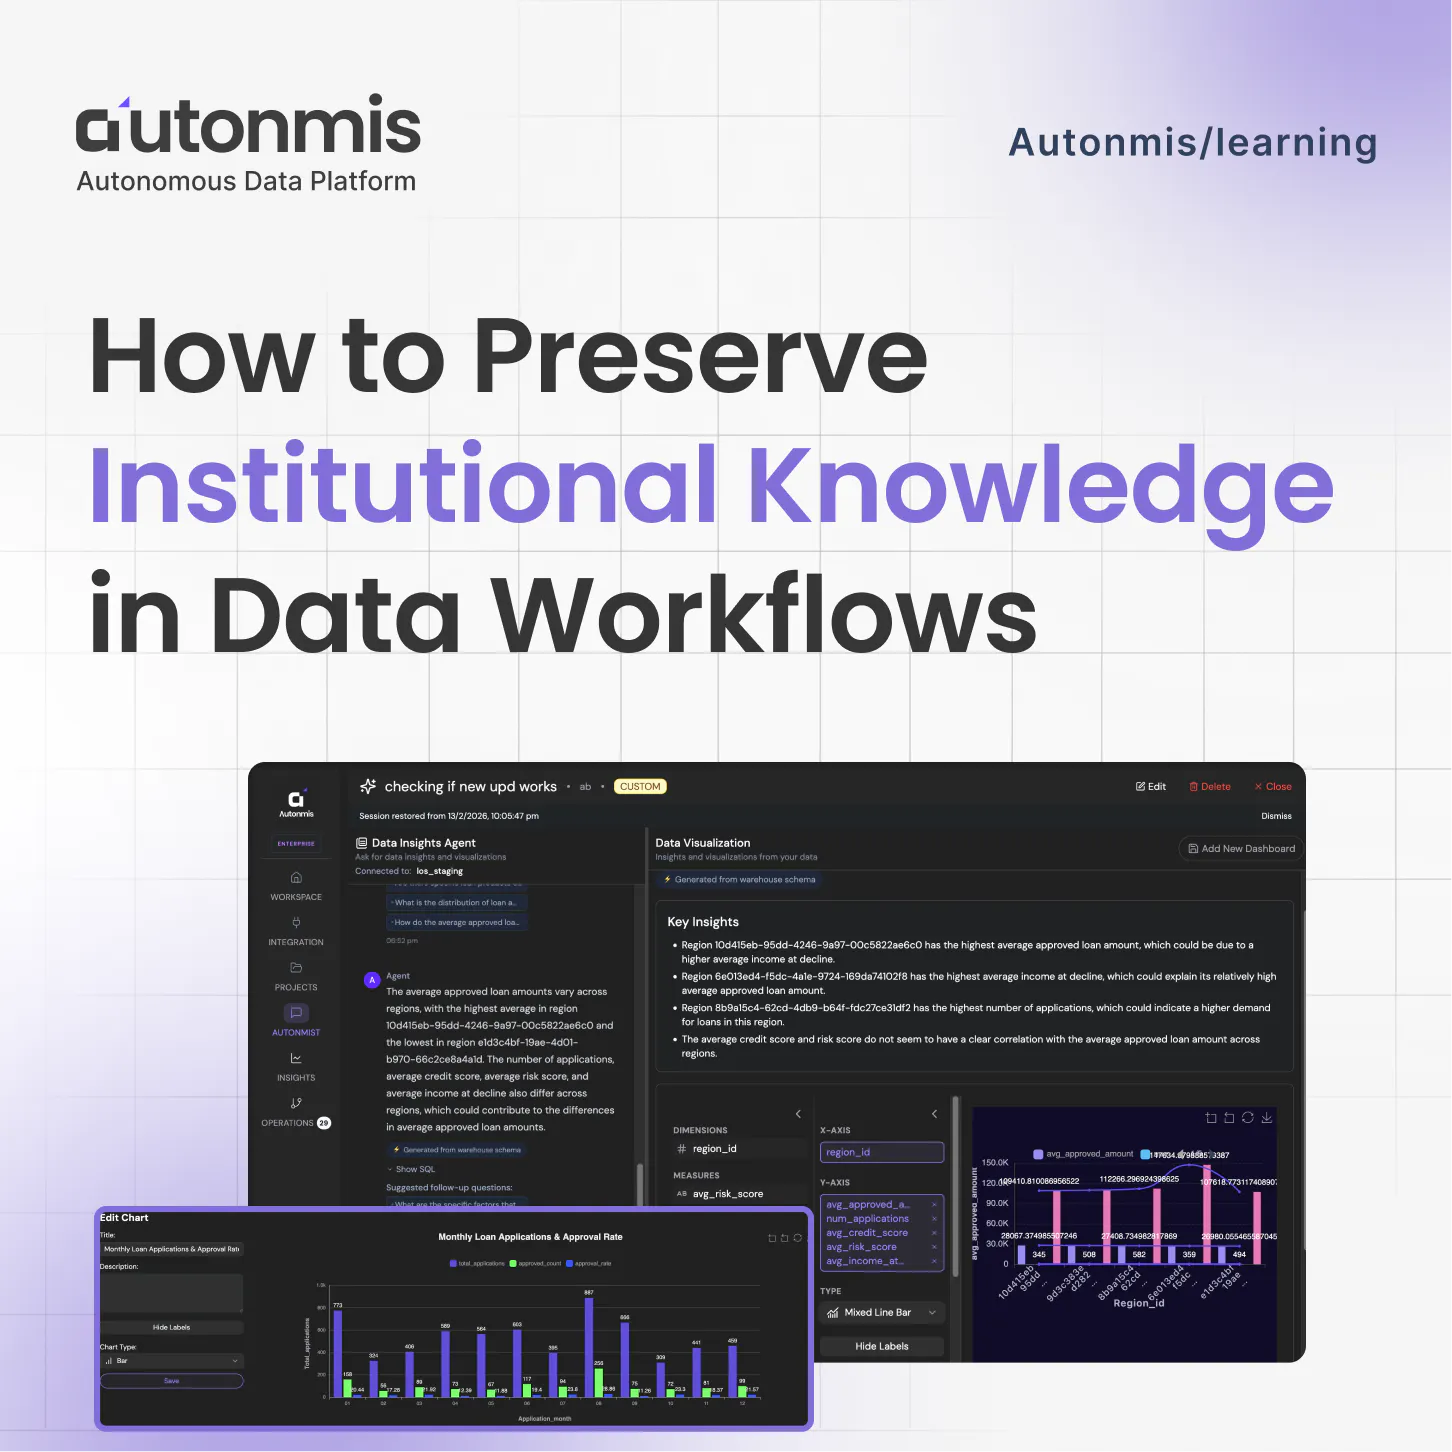
How to Preserve Institutional Knowledge in Data Workflows
Actionable Operations Excellence
Autonmis helps modern teams own their entire operations and data workflow — fast, simple, and cost-effective.